Author: BitpushNews
Bitcoin briefly stood above $100,000 at the beginning of this week, but quickly fell back as investors reassessed the outlook for interest rates this year and the market diverged on the future direction.
Friday's U.S. Department of Labor report showed that U.S. jobs increased by 256,000, far exceeding the expected 160,000, and the unemployment rate also fell to 4.1% from 4.2% in November. This change in expectations is seen as bearish for risky assets such as Bitcoin. U.S. Treasury yields rose to their highest level since November 2023 and the dollar strengthened, exacerbating pressure on the crypto market. After the report was released, Bitcoin fell from $95,000 to $92,000.
After the release of the non-agricultural report, Goldman Sachs expects the Federal Reserve to cut interest rates by a total of 50 basis points this year, and will cut interest rates by 25 basis points at the policy meetings in June and December respectively. The previous forecast was 75 basis points.

It is worth noting that on Wednesday, the spot Bitcoin exchange-traded fund (ETF) recorded the second largest single-day outflow since it began trading in January last year, which further shows that institutional investors are cautious about the cryptocurrency market.
Several positions worth watching: $92,000, $87,000 and $74,000
Since setting a new all-time high (ATH), Bitcoin prices have been facing huge selling pressure.
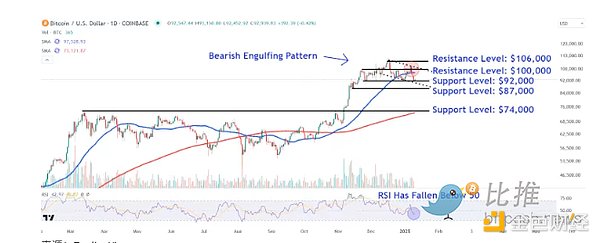
The technical chart released by Timothy Smith, a financial analyst at TradingView, shows that Bitcoin prices have recently formed a Bearish Engulfing Pattern, and the rally that broke through the $100,000 mark last week has paused. In addition, the relative strength index (RSI) has fallen below the 50 threshold, and the current price has also fallen below the important 50-day moving average (MA), indicating that buying momentum is weakening.
Analysts believe that the first support level to watch is around $92,000. This area could find buying interest around the late November retracement low and December trough, as well as the lower trendline of a potential new descending channel, which also forms support here.

A break below this could lead to a deeper drop to $87,000, which is where Bitcoin bulls on the chart may look for an entry point below the flag pattern that previously drove the cryptocurrency to new all-time highs.
However, if BTC closes below this level, it will open a downtrend towards around $74,000, and long-term investors may consider entering near the 200-day moving average (MA) near this area and the notable peaks in March and October. Such a decline would represent a correction of about 20% from the current price.
The chart provided by Timothy Smith shows that if bullish momentum returns, another attempt to hit the psychological barrier of $100,000 may be possible, and in turn retest the important $106,000 level. Traders who bought into the recent pullback may lock in profits near this level. On the other hand, analysts at Rekt Capital believe that Bitcoin’s bullish divergence at the bottom support level of the range at $91,000 indicates a possible rebound in the coming weeks.
Charles Edwards, founder of Capriole Fund, wrote on X.com: "Strong employment data actually means that the bull market may last longer than expected. This is the best data in six months and also sets the stage for the possibility of bottoming out in the unemployment rate."
Matt Mena, strategist for cryptocurrency research at 21Shares, expressed the same optimism. He said that a strong labor market, reduced recession concerns and the potential for bullish policies from the Donald Trump administration have created a very favorable environment for Bitcoin's continued rise.
In the short term, inflation data (including PPI and CPI) to be released next week will have an important impact on the Fed's policy expectations and may further influence the trend of risky assets such as Bitcoin.
 Anais
Anais


