Author: Digital Asset Research Source: substack Translation: Shan Ouba, Golden Finance
Last week we discussed why Bitcoin and other cryptocurrency markets are about to usher in a historic bull run. This week I want to highlight some other key signals that are flashing and provide us with the green light to start a bull run.
First, a few financial news appeared in my feed this morning and caught my attention.

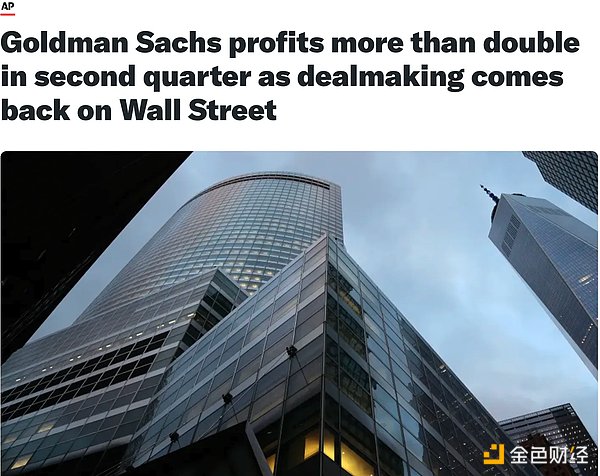
Goldman Sachs announced that its profits doubled in the second quarter, mainly due to the resumption of trading on Wall Street. We know that with the 18.6 year long real estate cycle, this is the headline we expect to see at this stage. The big banks making huge profits is key, but more important is how they do it…deals. Deals mean risk appetite is increasing, and even better, it means they need debt to underwrite these deals.
Speaking of deals, another piece of news that caught my eye was that Google is negotiating a record-breaking acquisition of up to $23 billion. You don’t see things like this happening in a market downturn.

So we have big banks and big tech companies pulling out their checkbooks and trading at the times we expected.
This behavioral risk and debt creation is directly reflected in the stock market. Last week, we saw a divergence between IWM (Russel 2000 Small Cap) and SMH (Semiconductors) that we haven't seen in a while. IWM surged nearly 5%, while SMH struggled to maintain its status quo and closed lower. The Dow also broke out to new highs after struggling in the face of SPY and QQQ rebounds in the past few weeks. The Dow may not be a risk signal, but it shows that market breadth is picking up as it is not comprised of large tech companies.

These are all signals of a shift to a riskier environment as stocks that have been lagging will start to catch up. You can see this in the stock price breadth indicator. Throughout 2024, this rally has had little breadth. But with last week’s big moves and extreme fear in this indicator, it looks like that is about to change and will start to move higher.
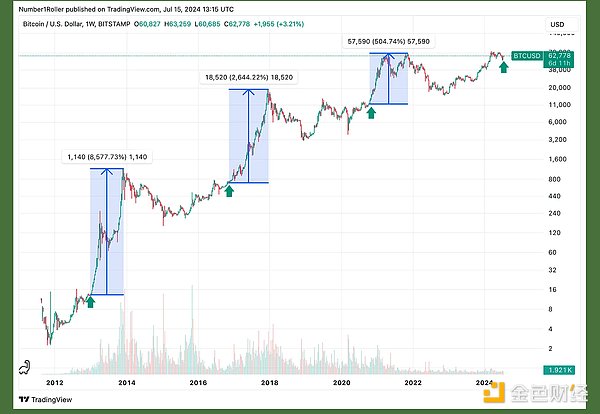
Historically, this all lines up perfectly with our current BTC price action.

The green arrow on the weekly BTC chart is the exact point in these cycles where the IWM breaks out. In each cycle, this is a key indicator of a massive risk rotation.
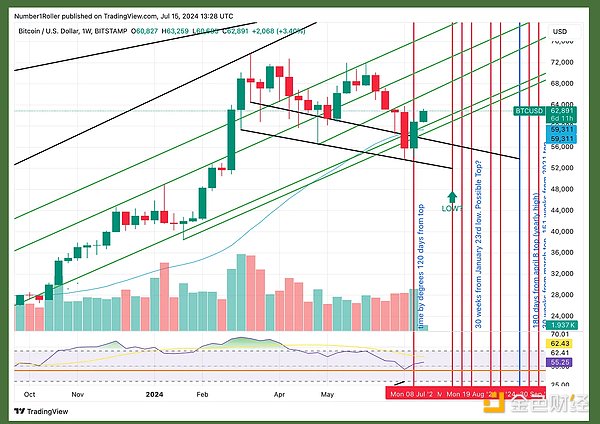
However, this will not happen overnight. As we highlighted in last week’s outlook, BTC ended a 4-week losing streak, but I would not be surprised if it continues to slowly rise over the next few weeks. Historically, we are entering a very bullish period, but in past cycles, momentum really started in the second half of the third quarter. That is, late August or September. We are still in the first few weeks of this quarter, so please be patient.

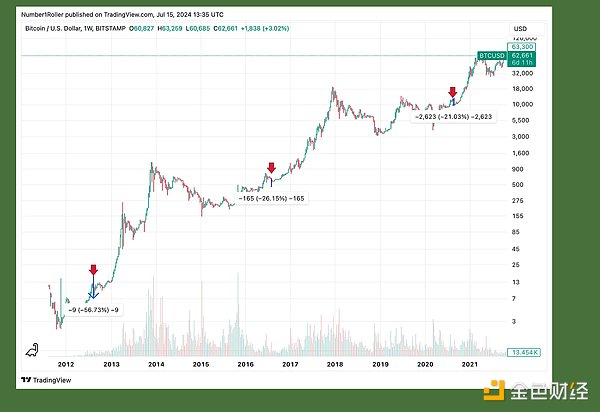
BTC is doing great on the weekly chart, but keep an eye on the early August window we have been highlighting. This phase of the cycle is known for flash dips that can be very bad, so watch out for it in the coming weeks. As shown by the red arrows in the chart below, each of the flash dips in August of the election cycle could have been bad, but at the same time were very short-lived, not lasting more than a week.

Continue to accumulate the strongest projects here, and be prepared if there is a "bottoming out again". If not, no problem. Just hold and wait patiently. I firmly believe that the best moment is coming, and every day of patient waiting will be worth it.
 Joy
Joy


