Author: Axel Adler Jr, Source: Author's Blog; Compiler: Tao Zhu, Golden Finance
Today, we will discuss the following topics:
1. Market Review.
2. Why is the bull market not over yet?
3. What is the real demand for previously expensive tokens?
4. The end of consolidation and support levels.
5. Conclusion.
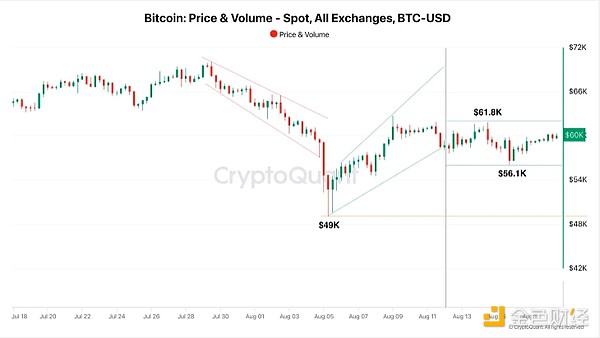
Throughout the week, Bitcoin traded between $61-56K, with no clear trend forming. This was basically a very quiet trading week. Resistance is the 200-day moving average at $68.2K, a level that the price failed to hold.
An interesting event this week was the news from Dubai, which recognized cryptocurrencies as an acceptable way to pay salaries, which shows the growing adoption of digital currencies.
Another important event concerns ETFs: BlackRock’s AUM surpassed Grayscale’s, thanks to outflows from Grayscale and inflows from BlackRock. Also, Grayscale appointed a new CEO. In case you didn’t know, the former CEO Michael Sonnenshein launched a Bitcoin Trust Fund that attracted a lot of investment totaling 653K BTC. The problem was that clients were unaware that there were smart money players in the market who were happy to sell expensive cryptocurrencies to newbies. As a result, some clients had to wait four years to realize their profits. The fact that investors in this fund had to wait four years is pretty amazing, given that Bitcoin’s four-year CAGR has never been less than 24%.
Is the bull run over?
Bull runs end when the demand to buy expensive tokens is less than the supply that wants to sell them. Let's look at the data to determine if the current market situation can be considered the end of the bull cycle.
The first thing we need to understand is whether there is a bubble in the market now.
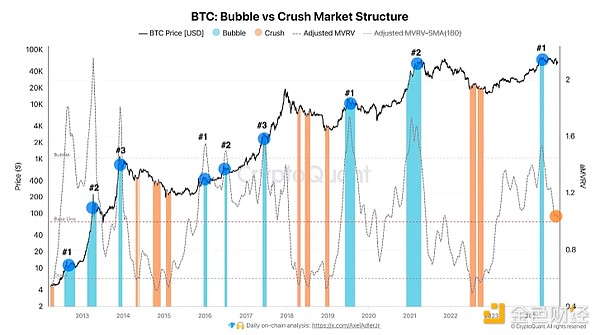
The Bubble and Crash Market Structure Indicator shows that the first bubble of this cycle formed at the $73,000 level. The current value has dropped to 1.02, which is the baseline, indicating that there is no bubble in the market. A bubble forms when the market value of Bitcoin increases faster than its actual market value, which essentially reflects speculative interest. In other words, at such times, many investors buy Bitcoin at high market prices due to FOMO (fear of missing out).
The next indicator that helps us understand whether the bull market has ended is the standard deviation of MV/RV, smoothed by two moving averages over 30 and 365 days.
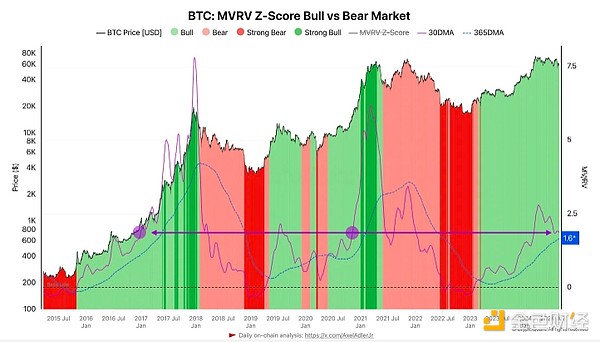
In the figure, we can see that the current bull cycle is developing quite steadily, without major anomalies or sharp rises. The 30DMA MVRV Z-score is 1.8, indicating that Bitcoin is minimally overvalued compared to the annual average of 1.6. We have seen that in previous cycles, the 30DMA MVRV Z-score rose above 5, which was usually accompanied by price peaks and subsequent corrections. This confirms that the current bull cycle is in an active phase and the market can be considered bullish as long as the indicator does not reach extreme levels that could signal the risk of a major correction.
What is the real demand for cryptocurrencies?
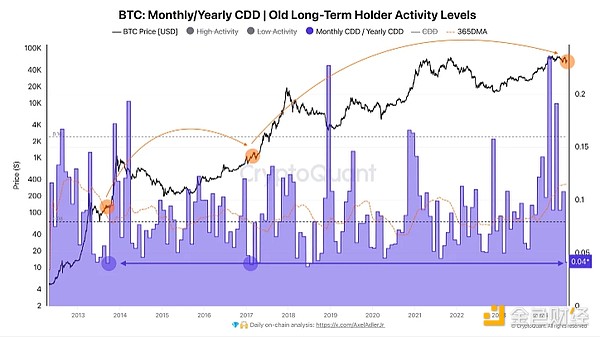
First, let's look at the behavior of experienced investors. We see that the activity of long-term holders peaked when Bitcoin reached $73,000. This means that at this level, a significant portion of experienced investors decided to take profits, causing the indicator to rise to 23%.
Currently, the activity of experienced investors has dropped to 4%. This shows that despite the current high price levels, long-term holders are not in a hurry to sell their assets. This could be a sign of confidence in further growth and expectations of future price increases.
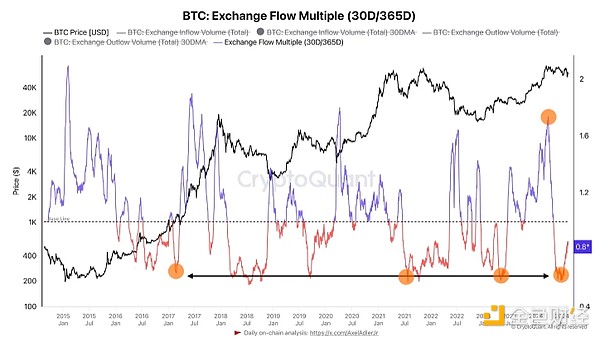
Let's see how many people are willing to sell Bitcoin on exchanges. The value of the Exchange Flow Multiple indicator dropped from 1.73 to 0.8, indicating a significant drop in sales activity on exchanges.
All of this tells us that there is little bearish pressure on the market right now, and investors are not in a rush to sell assets on exchanges.
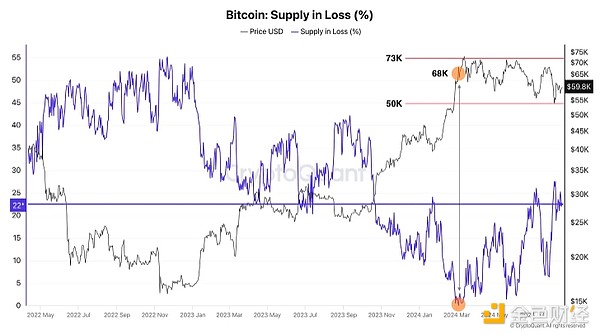
Let’s assess demand by looking at the number of tokens that are currently losing money and bought at a price above the current market price of $598,000.
The Loss Supply indicator shows the total amount of Bitcoin that is currently losing money (as a percentage). The current value is 22%, which means that 22% of all Bitcoins were purchased at prices above $598,000, which is about 4.3 million BTC. Such a large number of token transactions occurred in the past five months. Can this be seen as sustainable demand for previously expensive tokens? Apparently yes.
Finally, let's look at the indicators of realized profits and losses.
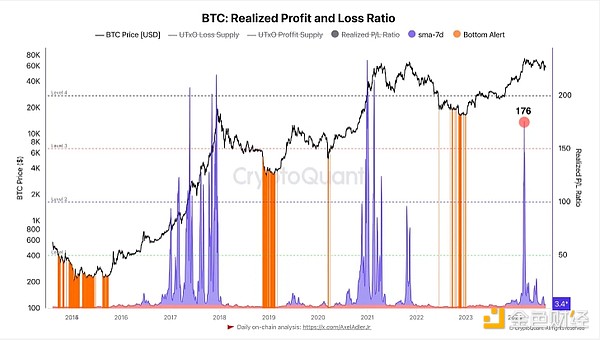
The current value is 3.4 points, which actually means selling at a loss. A further drop of 3.4 points in the indicator would trigger an orange alert and define it as a local bottom. Therefore, the current 365-day SMA average purchase price of BTC can be considered a strong support level for continued consolidation.
Conclusion
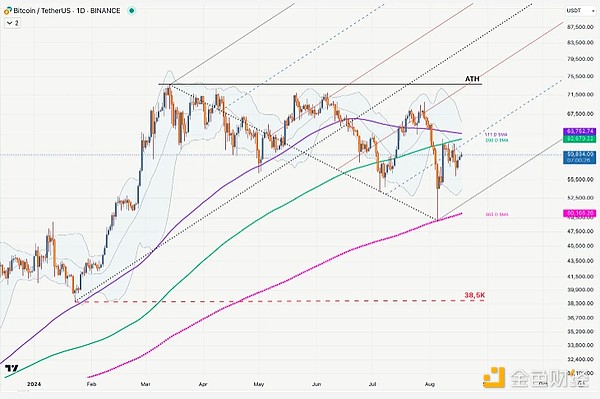
We are approaching the end of the consolidation, which, in my opinion, is progressing very well. We see that previously expensive tokens are now in demand and that this is happening within the framework of a bull cycle. We see that current liquidations of tokens are at breakeven or loss, which suggests that the consolidation is about to end. We also see that the market is not frothy and the standard deviation of the MV/RV indicator suggests that the current Bitcoin price is not overbought. We also understand that bearish pressure on exchanges is minimal and Bitcoin’s 365-day SMA Average Buy Price ($50,000) could act as a strong support level if the consolidation ends.
Good luck in the upcoming trading week!
 JinseFinance


