Source: Glassnode; Compiled by: Deng Tong, Golden Finance
Summary
Bitcoin has reached a local high of $107,000, which is almost consistent with its all-time high of $109,000 set in December 2024. This has driven a significant increase in capital inflows, pushing its real market capitalization above $900 billion for the first time, a record high.
As short-term holders experienced one of the most significant increases in profitability ever, spending activity by this group also surged, with average daily realized profits peaking at $747 million and cumulative profits over the past 30 days reaching $11.4 billion.
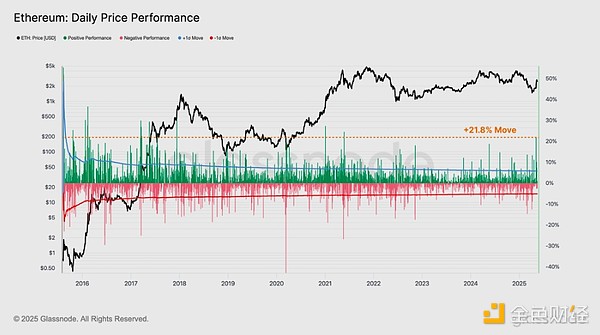
The price of Ethereum has experienced a significant surge in recent weeks, likely driven by the successful Pectra upgrade on May 7. The recent rally included multiple one-day price gains exceeding +1σ, most notably a +21.8% surge, the strongest one-day gain since May 2021.
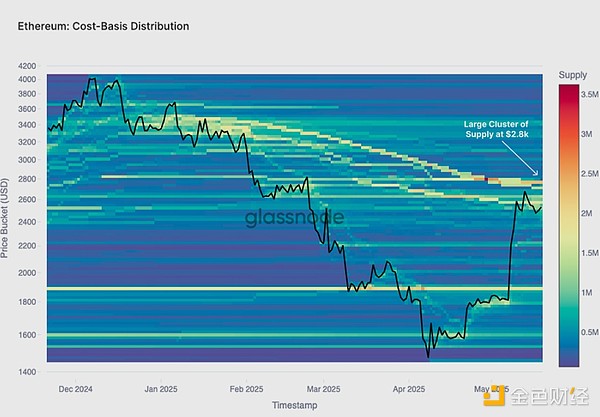
It is worth noting that the $2,400-2,900 range remains a critical area for Ethereum, acting as both a resistance zone and a potential breakout level necessary to maintain upward momentum.
Strong Trend
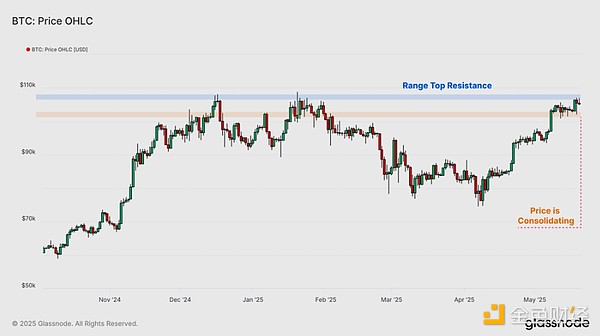
In recent weeks, the digital asset ecosystem has continued to strengthen, with Bitcoin leading the way, hitting a local high of $107,000 and is now just a stone's throw away from its all-time high of $109,000. The market encountered significant resistance between $102,000 and $105,000 and has been consolidating for the past two weeks.
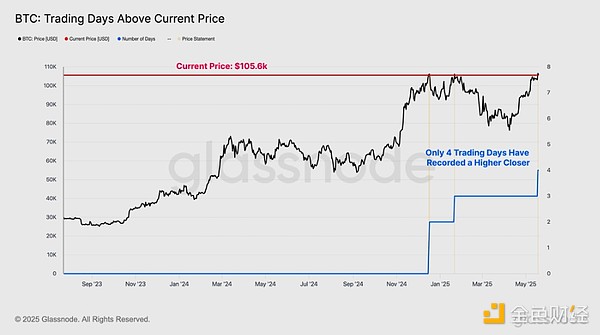
So far, there have been only four trading days with a single-day closing price of Bitcoin higher than this price. Last week's closing price reached $106,500, setting a record high. Bitcoin has also traded up about 40% over the past six weeks, highlighting the strength of the market’s recovery.
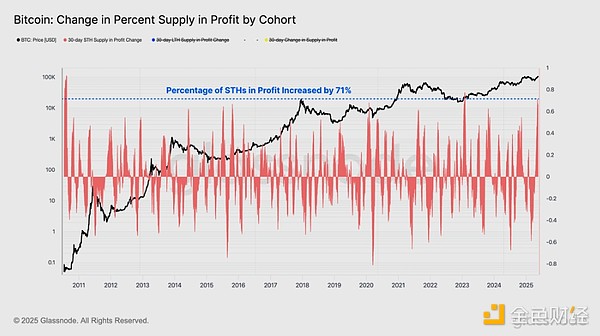
When the market recovers quickly from a decline, we can track the changes in the proportion of profitable supply held by different groups over a 30-day period. This helps us identify which investor groups benefit during the recovery and can reflect major shifts in market sentiment.
The recent price gains have provided significant financial relief to the short-term holder group in particular, with their profitable supply percentage increasing by +71% over the past month. This is the second largest positive growth in profitability ever for this group.
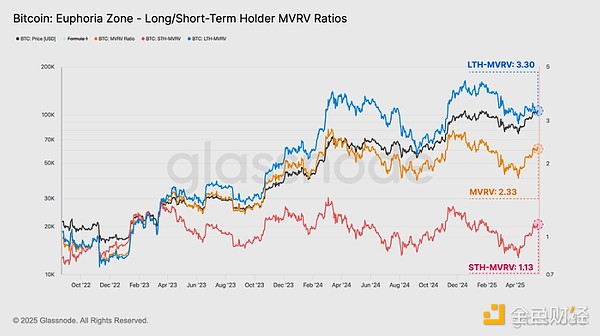
Another tool we can use to measure the improvement in investor profitability is to examine the change in the MVRV ratio for each cohort since the local price low of $74,000.
MVRV increased from 1.74 to 2.33 (unrealized gains increased from +74% to +133%).
STH MVRV increased from 0.82 to 1.13 (unrealized losses increased from -18% to +13% unrealized gains).
LTH MVRV increased from 2.91 to 3.30 (unrealized gains increased from +191% to +230%).
Notably, investors in all of these groups experienced significant improvements in their financial situations. This could have a knock-on effect, boosting investor confidence and sentiment.
As market conditions improve and investor portfolios recover, many are seizing the opportunity to lock in profits. Profit-taking in a bull market can be thought of as the opposite of new demand, which is absorbing supply.
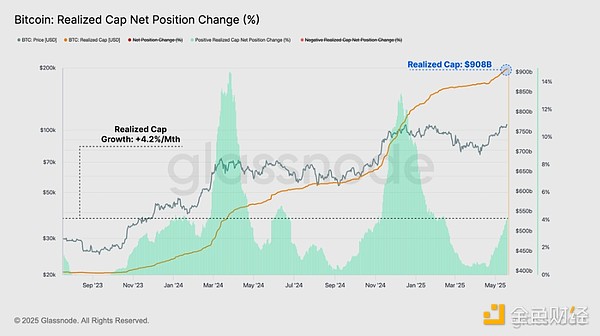
One way to quantify changes in the supply-demand balance is through the “realized market capitalization” metric, which summarizes the cumulative net capital inflows into digital assets. The total value of the Bitcoin network has increased by 4.2% over the past month, reflecting a significant increase in capital entering the market.
This brought Realized Market Cap to a new all-time high, exceeding $900 billion for the first time, a significant milestone that highlights the tremendous value investors are seeing in this leading digital asset.
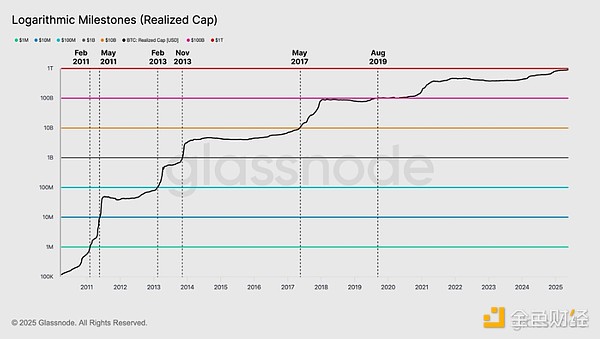
As realized market capitalization is about to break the $1 trillion milestone, we can track the trajectory of capital flows over the 16-year history of the Bitcoin network. The chart below shows the time interval between each logarithmic scale milestone in realized market capitalization:
$1 million: February 2011
$10 million: May 2011
$100 million: February 2013
$1 billion: November 2013
$10 billion: May 2017
$100 billion: August 2019
Between 2011 and 2013, realized market capitalization grew from $1 million to over $1 billion, crossing four logarithmic scale milestones in two years. Bitcoin was much smaller then than it is today and experienced exponential growth during the initial bootstrapping of the network. The next major milestone — $10 billion — took three and a half years to reach before the actual market value reached $10 billion in mid-2017.
The last logarithmic milestone – $100 billion – was reached nearly six years ago, in August 2019. This is the longest interval between logarithmic milestones, indicating that the asset’s appreciation and growth rate is slowing over time, taking longer and requiring increasing amounts of capital to cross the $1 trillion threshold.
Short-Term Holders Take Profits
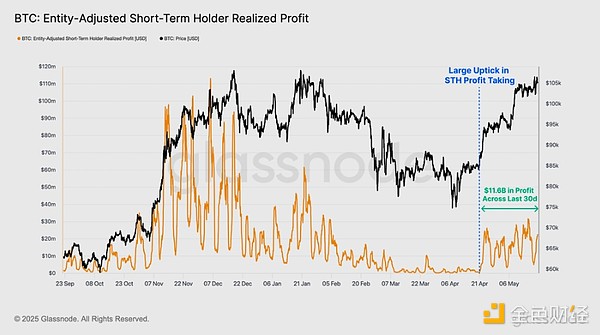
After the largest increase in profitability ever among short-term holders, many recent investors who bought on the dip may turn to profit-taking to take advantage of market strength.
As price accelerated towards the short term holder cost price of $93k and eventually broke through that level, we could see a significant increase in profit taking activity, peaking at $747m per day.
Over the past 30 days, we have seen short-term holders realize a cumulative profit of $11.4 billion. In contrast, they posted just $1.2 billion in profits over the past 30 days, highlighting the strong rebound in new investor sentiment and spending behavior.
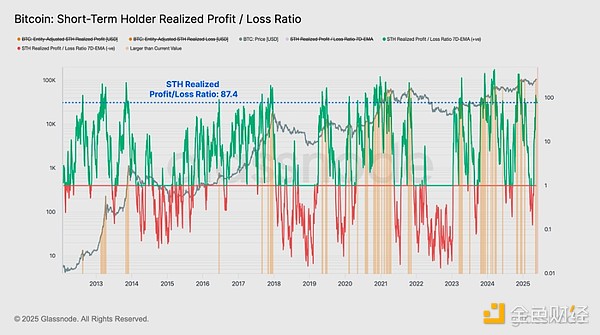
This shift caused the realized profit and loss ratio of short-term holders to soar sharply. Realized profits for short-term holders far exceeded realized losses, so only 8% of trading days had a high profit-loss ratio.
Historically, such high values are common during strong bullish momentum, but also tend to occur when markets rally into local and global top formations. Excessive profit-taking could overwhelm the inflow of new demand, leading to excess supply forming resistance.
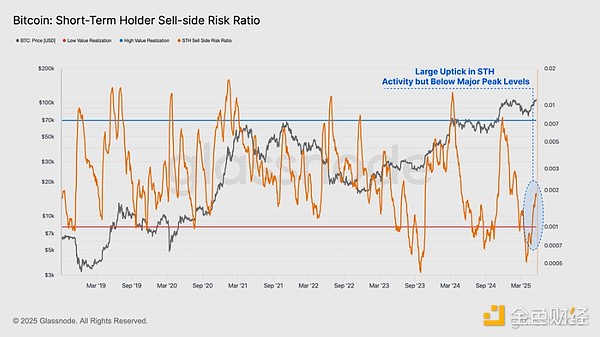
We can supplement this analysis with the sell-side risk ratio, which is a powerful tool for assessing how “equilibrium” the market is from the perspective of existing holders. We can think of this metric in the following framework:
High values indicate that the investor's profit or loss on spending tokens is large relative to their cost basis. This situation indicates that the market may need to rebalance and usually occurs after a large price movement.
The low values indicate that most tokens are being spent at prices relatively close to their breakeven cost basis, suggesting that a degree of equilibrium has been reached. This situation usually indicates that the "profit and loss" within the current price range has been exhausted and usually describes a low volatility environment.
For the short-term holder group, we can see that their sell-side risk ratio has risen sharply, although the ratio is still well below the common levels around major peaks. This suggests that the market may still have room to continue rising as investors have not yet locked in excessive profits relative to their total holdings.
Ethereum soars on Pectra upgrade
Ethereum is the world's second-largest digital asset, and the market environment has been challenging in recent years. Since 2023, ETH prices have failed to meet investor expectations and have yet to set new highs for this cycle.
However, in recent weeks, ETH price has experienced a significant surge, likely due to excitement surrounding the successful Pectra upgrade on May 7. The Pectra upgrade aims to consolidate the validator group and improve overall network efficiency.
The price of Ethereum has risen from $1,800 to a local high of $2,700, a 50% increase in a few weeks, bringing significant financial relief to investors.
During the recent rally, ETH prices have seen daily gains of more than +1σ on multiple occasions, with the most notable increase being as high as +21.8%, the strongest daily gain since May 2021.
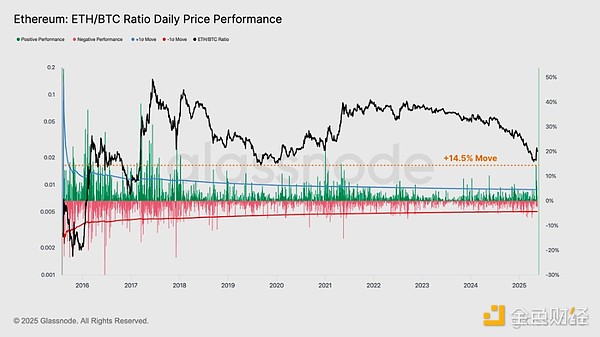
In this cycle, the difference in the performance of the two leading digital assets is reflected in the ETH/BTC ratio. Since the 2022 merger event, the ratio has been on a continuous downward trend. Recently, the ratio fell to 0.018, its lowest level since January 2020.
Ethereum’s recent outperformance has helped the ETH/BTC ratio recover, accelerating to 0.026, a 14.5% increase, the 46th increase on record.
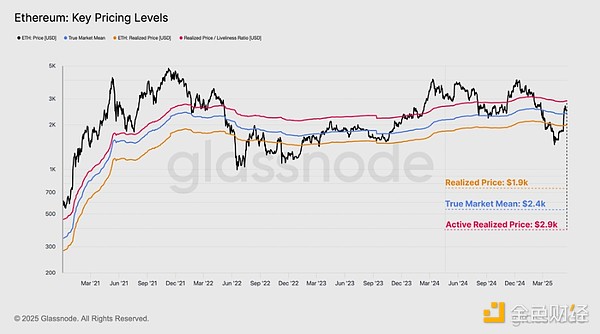
It is worth noting that this price rebound has decisively broken through the current realized price of $1,900. This suggests that the average ETH holder is now back into unrealized profit, providing significant financial relief to many holders.
Active realized price and true market mean are two alternative on-chain valuation models that typically trade near the midpoint of Ethereum market cycles. These metrics estimate the cost basis of active market participants and deduct lost tokens and long-term idle supply. This provides a more accurate picture of the cost basis of economically active investors.
Real market average price: US$2,400
Actual transaction price: US$2,900
Encouragingly, the price has also exceeded the real market average, highlighting the strong momentum of this price increase. However, the active realized price remains above and remains a critical level that must recover decisively to support the continued improvement in Ethereum investor confidence.
When examining the cost basis distribution of Ethereum, we can find some commonalities. Currently, investors' cost basis levels are mostly concentrated around $2,800. This area could increase sell-side pressure as many previously underfunded investors may seek to reduce risk and take profits at or near the breakeven point.
Conclusion
The digital asset market remains strong, and Bitcoin continues to consolidate around its all-time high of $109,000. Rising prices boosted profitability for the vast majority of investors in the market, with many seizing the opportunity to lock in profits. As a result, capital inflows increased significantly, pushing realized market capitalization above $900 billion for the first time, a historic milestone that highlights the depth of market liquidity.
For short-term holders, the increase in their portfolio value translated directly into a significant increase in spending activity, with this group realizing more than $11.4 billion in profits over the past month.
After the Pectra upgrade, Ethereum showed a strong market reaction, with its spot price rising from $1,800 to a high of $2,700. The rally allowed ordinary ETH holders to regain unrealized profits, bringing them significant financial relief. Notably, the $2,400-2,900 range remains a key area of focus, acting both as a resistance zone and a potential breakout zone to sustain further upward momentum.
 Brian
Brian
 Brian
Brian Weiliang
 Miyuki
 Alex
Alex Weiliang
 Brian
Brian Miyuki
 Alex
Alex Brian
Brian