Author: Zack Pokorny, Galaxy Research Analyst; Translated by: Golden Finance
Original link: https://www.galaxy.com/insights/research/the-state-of-crypto-lending/
Foreword
Lending is a use case for cryptocurrencies that has found strong product-market fit both on-chain and off-chain, with the market size of the entire category exceeding $64 billion at its peak. The lending market has also played an important role in building a financial ecosystem based on digital assets, enabling users to obtain liquidity for their holdings to deploy in DeFi and trade on-chain and off-chain.
This report explores the on-chain and off-chain cryptocurrency lending markets. The report is divided into two parts:
The first part introduces the history of the cryptocurrency lending market, its participants, its historical size (on-chain and off-chain), and some key moments in the industry.
The second part of the report dives deeper into how some lending products and other sources of leverage work in both on-chain and off-chain environments, who uses them, and the risks of each.
The report provides a comprehensive overview of the crypto lending market, shedding light on one of the most widely used yet opaque sectors of the cryptoeconomy. Crucially, the report provides rare insight into the size of the off-chain lending market, which has historically been an opaque area of the industry.
Key Takeaways
• The overall size of the crypto lending market remains well below the highs reached at the end of the 2020-2021 crypto bull run. As of Q4 2024, the total size of the crypto lending market, including crypto-backed collateralized debt position (CDP) stablecoins, was $36.5 billion, 43% lower than the all-time high of $64.4 billion in Q4 2021. This decline can be attributed to a significant reduction in lenders on the supply side, as well as a significant reduction in demand-side funds, individuals, and corporate entities.
• As of Q4 2024, the top three CeFi lenders include Tether, Galaxy, and Ledn, with a total loan amount of $9.9 billion as of the end of Q4 2024. Together, they account for 88.6% of the CeFi lending market and 27% of the entire crypto lending market, including crypto-backed CDP stablecoins.
• On-chain lending applications have experienced strong growth since the bear market bottom of $1.8 billion at the end of Q4 2022. As of Q4 2024, 20 lending applications and 12 blockchains had a total of $19.1 billion in open borrowing. This means that DeFi open borrowing has grown 959% in eight quarters.
History and Current Status of the Lending Market
Currently, there are two main channels that provide cryptocurrency-based lending services: DeFi and CeFi. These two channels have their own characteristics and provide different products. Here is a brief overview of CeFi and DeFi lending:
1. Centralized Finance (CeFi) - Centralized off-chain financial companies that provide lending services for cryptocurrencies and crypto-related assets. Some of these entities use on-chain infrastructure or build their entire business on-chain. CeFi lending is mainly divided into three categories:
• Over-the-Counter (OTC) - OTC transactions are provided by centralized institutions, providing a full range of customized lending solutions and products. OTC transactions are conducted on a bilateral basis, allowing customized agreements to be reached between borrowers and lenders. The terms of the OTC agreement will be customized to the specific needs of both parties, including interest rates, terms, and loan-to-value ratios (LTV). Such products are generally only available to qualified investors and institutions.
• Prime Broker - A comprehensive trading platform that provides margin financing, trade execution, and custody services. Users can withdraw margin financing from prime brokers for other purposes or keep it on the platform for trading activities. Prime brokers typically provide financing for a limited number of crypto assets and crypto ETFs.
• On-chain private credit – allows users to pool funds on-chain and deploy them through off-chain protocols and accounts. In this case, the underlying blockchain effectively becomes a crowdsourcing and accounting platform for off-chain credit needs. Debt is often tokenized, either as a collateralized debt position (CDP) stablecoin or directly issued in the form of tokens representing shares of the debt pool. The use of the proceeds is usually narrow.
2. Decentralized Finance (DeFi) – Blockchain-based applications driven by smart contracts that allow users to borrow against cryptocurrencies, lend for yield, or obtain leverage when trading. DeFi lending business is unique in that it operates 24 hours a day, 7 days a week, provides a wide variety of borrowable and collateral assets, and is fully transparent and auditable by anyone. Lending applications, collateralized debt positions, stablecoins, and decentralized exchanges allow users to obtain leverage on-chain.
• Lending applications – On-chain applications that allow users to deposit collateral assets (such as BTC and ETH) and use them to borrow other cryptocurrencies. The loan terms are based on the collateral assets provided and the borrowed assets, and are pre-determined through a risk assessment on the application. Lending through these applications is similar to traditional overcollateralized loans.
• Collateralized Debt Position Stablecoins - USD stablecoins overcollateralized by a single or basket of cryptocurrencies. The principle is similar to overcollateralized lending, but synthetic assets are issued based on the collateral deposited by the user.
• Decentralized Exchanges - Some decentralized exchanges allow users to use leverage to expand their trading positions. While decentralized exchanges function differently, exchanges that provide margin play a similar role to CeFi prime brokers. However, earnings are generally not transferable from decentralized exchanges.
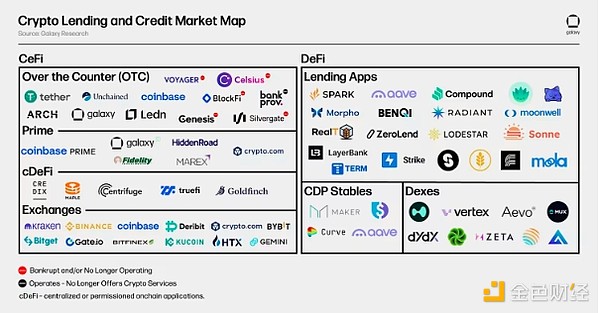
The market overview below highlights some of the major players in the CeFi and DeFi crypto lending markets, both past and present. As crypto asset prices plummeted and market liquidity dried up, some of the largest CeFi lenders by loan book size collapsed in 2022 and 2023. Most notably, Genesis, Celsius Network, BlockFi, and Voyager filed for bankruptcy within the same two years. This caused the total size of the CeFi and DeFi lending markets to plummet by about 78% from the peak in 2022 to the bear market trough, and CeFi lending lost 82% of its open borrowing. More information about the history, evolution, and size of the crypto lending market will be introduced in the following sections.
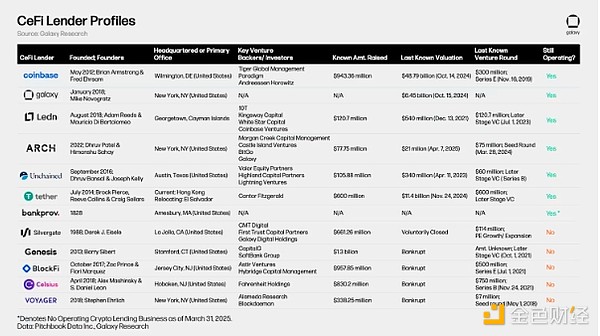
The table below compares some of the largest CeFi cryptocurrency lending institutions in history. Some of these companies provide multiple services to investors, such as Coinbase, which operates primarily as an exchange but also provides credit to investors through over-the-counter cryptocurrency loans and margin financing.
History of Crypto Lending
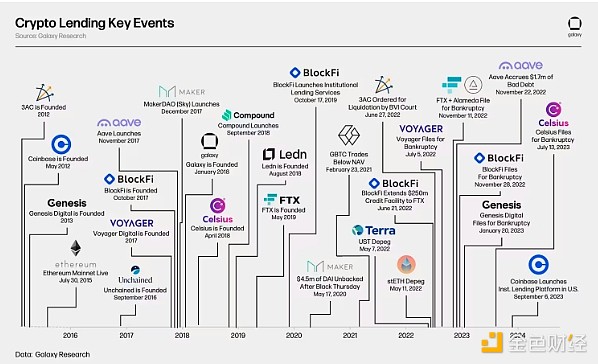
While on-chain and off-chain crypto lending did not become widely used until late 2019/early 2020, some current and historically important players were formed as early as 2012. Notably, Genesis was founded in 2013 and has a loan size of $14.6 billion. On-chain lending and CDP stablecoin giants such as Aave, Sky (formerly MakerDAO), and Compound Finance were launched on Ethereum between 2017 and 2018. These on-chain lending solutions were only possible after Ethereum and smart contracts went live in July 2015.
The tail end of the 2020-2021 bull run marked the beginning of a turbulent 18 months for the crypto lending market, a period plagued by a wave of bankruptcies. Some of the key events during this time include: Terra’s stablecoin UST depegging, ultimately becoming worthless like LUNA; Ethereum’s largest liquid staking token (LST) stETH depegging; and Grayscale’s Bitcoin Trust GBTC trading at a discount to net asset value (NAV) after years of rising premiums.
Lending Market Size
Measured by the end-of-quarter snapshot data, the total size of the DeFi and CeFi crypto lending markets is still far below the highs set in the first quarter of 2022. This is mainly due to the lack of recovery in CeFi lending after the 2022 bear market and the losses of the largest lenders and borrowers in the market. The following article will explore the size of the crypto lending market from the perspective of CeFi and on-chain platforms.
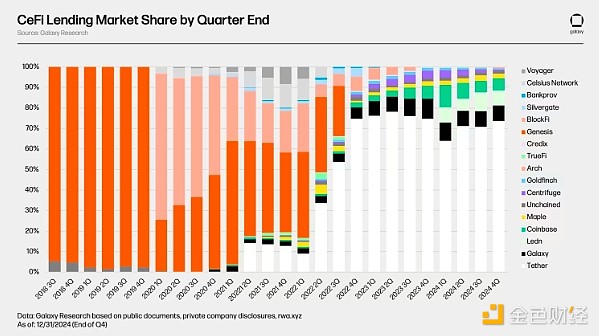
Galaxy Research estimates that at its peak, the total loan size of CeFi lenders with available data was US$34.8 billion; at its trough, the estimated value of the CeFi lending market was US$6.4 billion (down 82%). As of the end of the fourth quarter of 2024, the total outstanding CeFi borrowing was $11.2 billion, down 68% from the historical high and up 73% from the bear market trough.
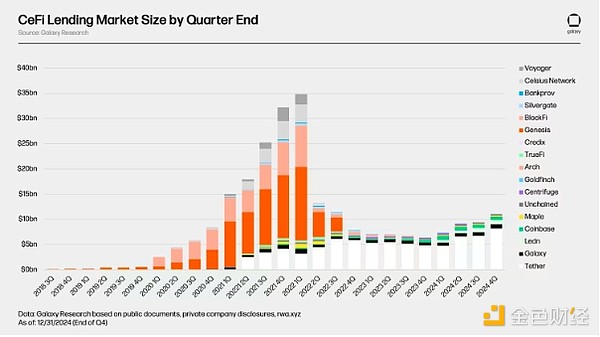
As the CeFi lending market has shrunk over the past three years, outstanding loan amounts have been concentrated in the hands of a smaller number of lenders. At the peak of the CeFi lending market in the first quarter of 2022, the top three lenders (Genesis, BlockFi, and Celsius) accounted for 76% of the market share, holding $26.4 billion of the $34.8 billion in outstanding loans from CeFi lenders. Today, the top three lenders (Tether, Galaxy, and Ledn) collectively hold 89% of the market share.
When assessing the market dominance of one lender relative to another, it is important to be aware of the differences between lenders, as not all CeFi lenders are the same. Some lenders only offer certain types of loans (e.g., BTC-only collateral products, altcoin-only collateral products, and cash loans without stablecoins), only serve certain types of clients (e.g., institutional clients vs. retail clients), and only operate in certain jurisdictions. The combination of these factors makes some lenders larger than others by default.
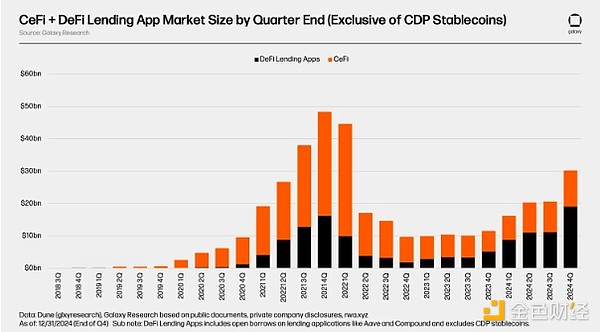
As shown in the figure below, DeFi lending through on-chain applications such as Aave and Compound has achieved strong growth since the bear market trough of $1.8 billion in open lending. As of the end of the fourth quarter of 2024, the outstanding lending scale of 20 lending applications and 12 blockchains reached $19.1 billion. This means that in the eight quarters since the bottom, the outstanding lending scale of DeFi on the observed chains and applications has increased by 959%. As of Q4 2024, outstanding loans through on-chain lending applications are 18% higher than the peak of $16.2 billion reached during the 2020-2021 bull run.
DeFi lending has seen a stronger recovery than CeFi lending. This can be attributed to the permissionless nature of blockchain-based applications and the fact that lending applications have survived the bear market turmoil that caused major CeFi lenders to close. Unlike those large CeFi lenders that went bankrupt, large lending applications and marketplaces were not forced to shut down en masse and continued to operate. This fact is a testament to the design and risk management practices of large on-chain lending applications, as well as the advantages of algorithmic lending, over-collateralization, and supply-demand based lending models.
Total open interest in the cryptocurrency lending market (excluding the market cap of crypto-collateralized CDP stablecoins) peaked at $48.4 billion at the end of Q4 2021. Four quarters later, in Q4 2022, the cumulative market size bottomed out at $9.6 billion, down 80% from the peak. Since then, the market has expanded to $30.2 billion, driven primarily by the expansion of DeFi lending applications, a growth rate of 214% based on data from the end of the fourth quarter of 2024.
Note that there may be double counting between the total size of CeFi loan books and the amount of DeFi borrowing. This is because some CeFi entities rely on DeFi lending applications to provide borrowing services to off-chain customers. For example, a hypothetical CeFi lender may use its idle BTC to borrow USDC on-chain and then lend that USDC to off-chain borrowers. In this case, the CeFi lender's on-chain borrowing will appear in DeFi open interest and appear in the lender's financial statements as open interest to its customers. The lack of information disclosure and on-chain attribution makes it difficult to screen for such dynamics.
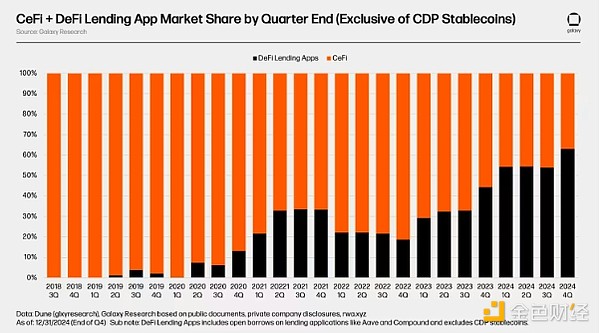
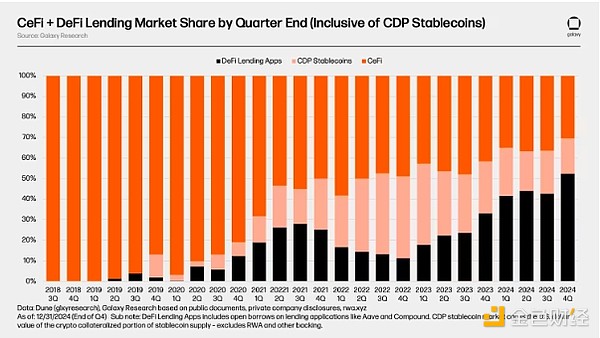
A notable change in the cryptocurrency lending market is that DeFi lending applications have dominated CeFi platforms as the market has emerged from the bear market and begun to recover. During the bull market cycle from 2020 to 2021, DeFi lending applications accounted for only 34% of the total cryptocurrency lending (excluding the market value of crypto-collateralized CDP stablecoins); as of the fourth quarter of 2024, this share has risen to 63%, almost doubling.
After including the market capitalization of crypto-collateralized CDP stablecoins, the total size of the crypto lending market exceeded $64.4 billion in Q4 2021. At the bottom of the bear market in Q3 2023, the market size was only $14.2 billion, down 78% from the bull market peak. As of Q4 2024, the market has rebounded 157% from the low point in Q3 2023 to a total size of $36.5 billion.
Note that, as with lending through DeFi lending applications, there may be double counting between the total size of the CeFi loan book and the supply of CDP stablecoins. This is because some CeFi entities rely on minting CDP stablecoins backed by crypto collateral to provide lending services to off-chain customers.
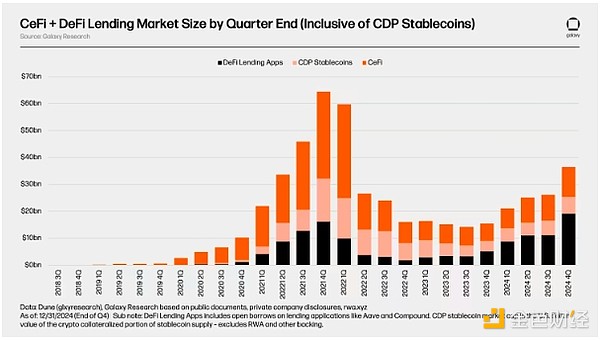
The growth trend of on-chain lending market share will be even more significant if crypto-collateralized debt position (CDP) stablecoins are taken into account. As of the end of the fourth quarter of 2024, DeFi lending applications and CDP stablecoins together accounted for 69% of the entire market. Since the fourth quarter of 2022, its share has been steadily increasing. It is worth mentioning that the dominance of CDP stablecoins as a source of crypto-collateralized leverage is gradually weakening. This is partially due to the increase in stablecoin liquidity, improved lending application parameters, and the introduction of delta-neutral stablecoins like Ethena.
Market Data Logic and Sources
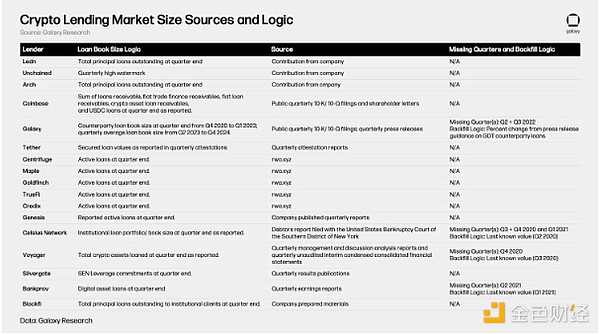
The following table highlights the various sources and logic for the DeFi and CeFi lending market data mentioned above. DeFi and CeFi data can be retrieved through on-chain data, which is transparent and easy to obtain, while CeFi data is more complex to retrieve and more difficult to obtain. This is due to factors such as how CeFi lenders account for their outstanding loans, the frequency of public information, and the general difficulty of obtaining such information.
Venture Capital and Crypto Lending
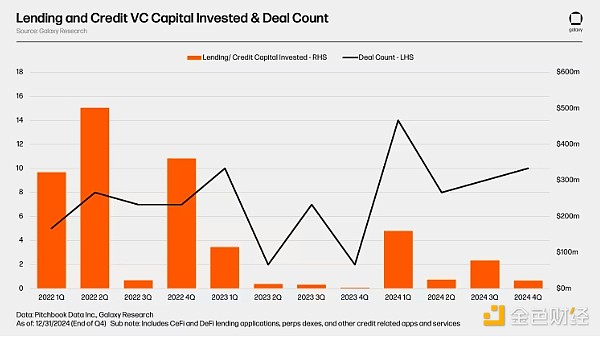
Between Q1 2022 and Q4 2024, CeFi and DeFi lending/credit applications and platforms raised a total of $1.63 billion in 89 transactions with known financing amounts. The category had the highest quarterly financing amount in Q2 2022, with at least $502 million in financing in 8 transactions. Q4 2023 was the lowest month for financing, with a total financing amount of only $2.2 million.
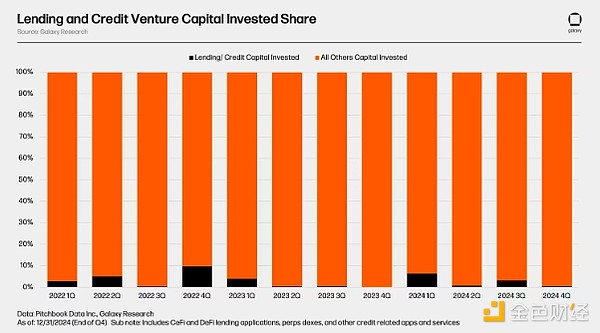
Venture capital flowing into lending and credit applications accounts for only a small portion of total venture capital in the crypto economy. Between Q1 2022 and Q4 2024, lending and credit applications accounted for an average of only 2.8% of all venture capital in the sector per quarter. Lending and credit applications accounted for the highest share of total quarterly funding in Q4 2022, at 9.75%. In the most recent quarter, Q4 2024, they accounted for only 0.62% of total funding.
Reference Galaxy Research's coverage of the crypto venture capital sector for a more comprehensive understanding of historical trends in crypto venture capital financing.
What went wrong?
In the second half of 2022 and early 2023, the cryptocurrency lending market experienced a dramatic crash, with industry giants going bankrupt. These giants include BlockFi, Celsius, Genesis, and Voyager, which together accounted for 40% of the entire cryptocurrency lending market and 82% of the CeFi lending market at its peak. The collapse of these lenders was ultimately attributed to the collapse of the entire cryptocurrency market, although their plight was exacerbated by poor risk management and acceptance of poor collateral from borrowers.
The Cryptocurrency Market Collapse and Its Impact on Collateral Value
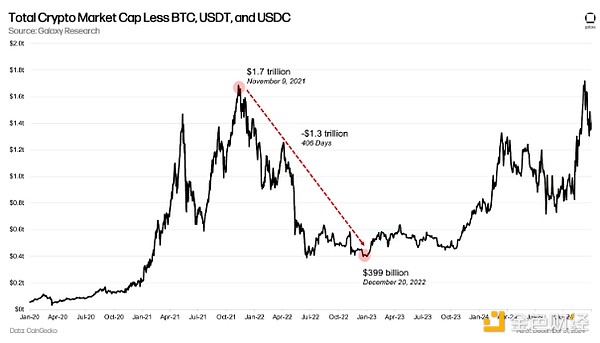
The collapse in asset prices was the primary factor leading to the credit crunch in the crypto lending market. Excluding BTC, USDC, and USDT, digital asset market capitalization has evaporated by nearly $1.3 trillion (77%) in the 406 days since reaching a cycle high on November 9, 2021. This includes the evaporation of approximately $18.7 billion worth of Terra UST stablecoins and approximately $39 billion worth of LUNA tokens. This resulted in collateral assets either becoming worthless or difficult to dispose of as liquidity dried up, and borrowers were trapped in unsustainable transactions.
Grayscale's Bitcoin Trust and Liquid Staked ETH
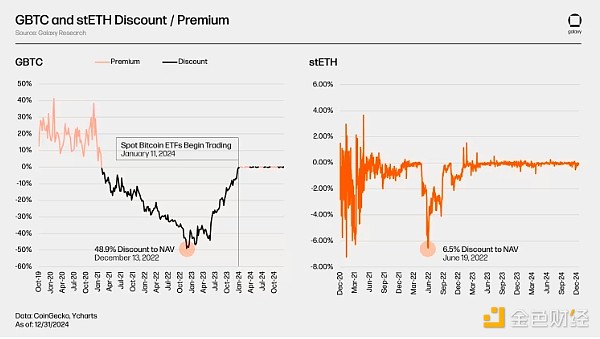
The downward trend in the market has caused the collateral assets widely used by institutional borrowers to become "toxic". It is worth noting that illiquid assets such as stETH, GBTC and ASIC Bitcoin mining machines have caused the widely used collateral to depreciate rapidly.
The problem with stETH and GBTC in particular is that they do not give investors the privilege of redeeming their underlying assets: stETH redeems ETH and GBTC redeems BTC. At the time, Ethereum beacon chain staking withdrawals were not yet enabled, and users could not withdraw the ETH they locked in the staking contract, and GBTC did not allow investors to withdraw BTC under each share due to product structure restrictions. This means that the secondary market liquidity of stETH and GBTC is much lower than their underlying assets, and they have to bear all the selling pressure. The end result is that these assets are trading at a discount to their underlying value, exacerbating the already huge pressure on crypto asset collateral. As the market closed positions, the discount rate of stETH fell to 6.25% at one point, and the discount rate of GBTC was as high as 48.9%.
Bitcoin ASIC
A similar situation also occurs in Bitcoin ASIC mining machine mortgage loans issued to miners. ASIC mining machines have a dual problem as collateral: 1) the income they generate, and ultimately their value, is closely related to the price of BTC and mining difficulty; 2) the launch of new generation mining machines has put pressure on the value of old generation mining machines. These factors, coupled with the poor liquidity of mining machines themselves, have caused the value of mining machines to fall sharply relative to Bitcoin, or that the mining machines used as collateral cannot be disposed of at all.
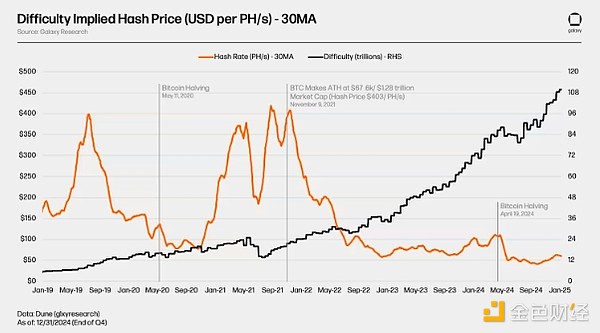
Hash rate price is an indicator of the expected daily income of an ASIC mining machine per unit of hash rate (before deducting mining costs). It is usually expressed in USD/(TH/s) or USD/(PH/s). For example, a miner with a hashrate of 0.1 PH/s, with a hashrate price of $100/PH/s, can expect to earn $10 per day (after operating costs). This figure, combined with other factors, can be used to extrapolate and discount future earnings/profits to arrive at the value of the miner.
The chart below highlights the trend of hashrate price and difficulty during the 2022 bear market. In November 2021, Bitcoin closed at a cycle high of $67,600, with a hashrate price of $403 per PH/s and a difficulty of about 21.7 quintillion hashes. In the subsequent 13 months, Bitcoin's price fell 75% to around $16,600 and difficulty rose 58%, causing the hashrate price, and thus the estimated revenue of ASICs, to fall 86%. Note the 11% difference between Bitcoin's performance and the hashrate price crash. This difference is due to the increase in mining difficulty. Rising difficulty means more competition among miners, which, combined with the daily fixed issuance of Bitcoin, ultimately results in less BTC generated per unit of hash power on the network, and thus less revenue. This dynamic is a factor that has led to huge losses in the value of ASICs.
The decline in revenue from ASIC miners has negatively impacted their selling prices. Each mining machine classified by efficiency has experienced an 85% to 91% decline in value per unit of hash power from its cycle high to the low point of Bitcoin price in December 2022. As a result, in some cases, the value of collateral loans provided to miners has lost more than 90%. It is important to note that this chart only shows the most commonly used ASIC miners before and during the bear market, which are more likely to be used as collateral for miner loans.
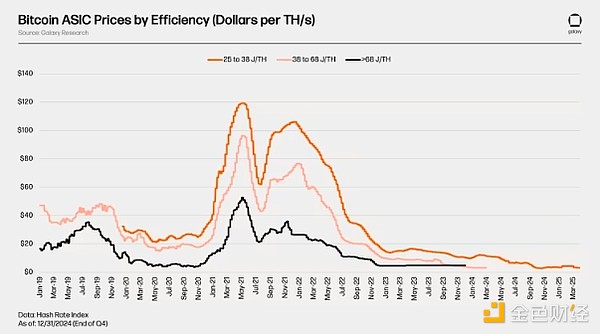
The decline in BTC prices and the increase in mining difficulty are not the only headwinds facing the value of ASICs. New, more efficient miners have been launched in 2021 and 2022, including Bitmain's first miner with a J/TH below 21 in August 2022. This puts more pressure on older miners used as collateral because they are relatively less attractive for mining.

Poor Risk Management
To make matters worse, many well-known cryptocurrency lenders at the time had poor risk management practices. However, after the bear market, the industry has begun to self-regulate in the absence of clear regulatory guidelines; this includes stricter risk management and more thorough due diligence. Nonetheless, the lack of risk management by lenders and their poor execution played a major role in the digital asset crash in 2022 and 2023.
Asset-Liability Management
Lenders before the FTX era failed to properly manage the liquidity of their books. Basically, many institutions would lend on a regular basis and borrow short-term, expecting to replenish liquidity when needed. However, when lenders needed to recover funds in large quantities, there was not enough liquidity to meet the demand. Borrowers were either heavily indebted and unable to repay the borrowed funds, or held term loans that lenders could not recover.
Poor Credit Risk Management
Providing unsecured or under-collateralized loans was a common practice among crypto lenders before FTX. For example, it is estimated that up to 36.6% of Celsius’ institutional loans were held by unsecured borrowers, while BlockFi also provided unsecured loans to FTX. Lenders also had flawed vetting procedures, failed to adequately verify whether counterparties were solvent, and lent funds to unqualified borrowers.
Weak Internal Risk Controls
The asset-liability mismatch and lack of credit risk management were attributed to weak internal risk controls. Before the FTX era, many lenders did not have clear risk parameters or templates for loan risk limits. Most of the problems with weak internal controls were company-specific rather than industry-wide. Although some lenders fell victim to the widespread spread of the 2022 cryptocurrency market crash, the lending standards and controls they established helped them survive the bear market.
Where will the cryptocurrency lending market develop next?
Now that the market has begun to recover and cryptocurrency lending is also on an upward trend, there are some key changes to watch for in the coming year. They are as follows:
For CeFi lending, traditional institutions like Cantor Fitzgerald, major lenders, and banks entering the market have created opportunities to obtain funds through existing banking channels, thereby increasing competition and reducing the cost of funds. Because these institutions bring strong financial resources and strong market infrastructure to the field, this increased competition and access to low-cost funds has also enhanced liquidity and accessibility/scale of services. These entities enter the crypto economy out of personal interest as well as measures by regulators. Most notably, the SEC’s revocation of SAB-121 by issuing SAB-122 has added a tailwind to crypto lending, as SAB-121 removed the requirement for public companies (many banks are public companies) to list customer digital assets on their own balance sheets. This requirement of SAB-121, combined with separate bank capital requirements, effectively makes it nearly impossible for banks to provide crypto custody services, hampering their ability to provide ancillary services such as lending. In addition, the rise of Bitcoin ETPs in the United States has enabled high-quality lending platforms to enter and provide leverage as well as lending with ETPs as collateral, further expanding the crypto-related lending market.
For on-chain private credit, the future depends on tokenization, programmability, utility, and the resulting yield enhancements. The tokenization of off-chain debt introduces elements of transparency and automation that are not available in traditional debt instruments. The combination of these two factors allows for better risk management, which in turn increases the risk tolerance of lenders and reduces management costs, allowing lenders to move further down the risk curve and earn more returns. In addition, the utility of private credit tokens in the on-chain economy will continue to expand. Serving as collateral for lending applications or minting CDP stablecoins will likely be the first major use case for these tokens on-chain.
For DeFi lending, the future lies in expanding its institutional user base and centralized off-chain companies built on the lending application technology stack. Increased institutional adoption stems from 1) financial companies becoming more familiar with the risks of blockchain and on-chain applications, 2) the benefits of supplementing off-chain operations with on-chain outlets, 3) regulatory clarity on digital assets from major governments, and 4) the liquidity base and the relative volume of on-chain lending activity relative to off-chain lending activity are growing. In addition, be wary of centralized companies built on the lending application technology stack. As these companies issue assets (such as private credit tokens) and move more of their business on-chain, it is possible that they will want to use blockchain infrastructure to support the utility of their tokens and company operations. An example of this is Ondo Finance's Flux protocol, a fork of Compound v2 designed to support the utility of its OUSG Treasury token.
Data-Driven Crypto Lending Insights
The following highlights historical trends in on-chain and off-chain lending activity, including interest rates, the size of various CDP stablecoins, and the assets most commonly borrowed and used as collateral.
Activity
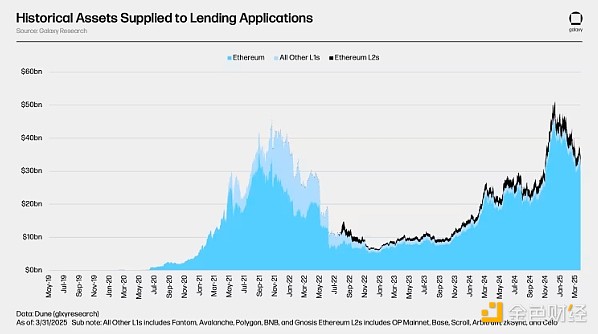
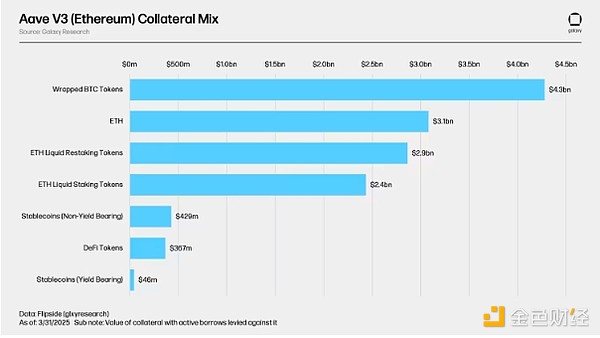
Lending is the largest DeFi category across all blockchains, and Ethereum is the largest lending chain by asset deposits and borrowings. As of March 31, 2025, the total assets deposited on the 12 Ethereum EVM-based L1 and L2 blockchains are $33.9 billion. There are an additional $2.99 billion in deposits on Solana, not shown in the chart below. $30 billion (81%) of these deposits are deposited on Ethereum L1. Aave V3 on Ethereum L1 is the largest lending market, with $23.6 billion in deposits as of March 31, 2025. It is important to note that loan application deposits cover both assets used as collateral and assets deposited solely for yield opportunities. Assets actively used as collateral on Ethereum Aave V3 are detailed below.
Wrapped Bitcoin tokens (WBTC, cbBTC, and tBTC), ETH, and ETH liquidity (re)collateralized tokens (stETH, rETH, ETHx, cbETH, osETH, and eETH) are the most commonly used collateral in Ethereum Aave V3. In total, there are $13.5 billion worth of collateral assets and loans backed by these assets. In total, these assets have a borrowing value of $8.9 billion, with an average loan-to-value (LTV) of 65.9%.
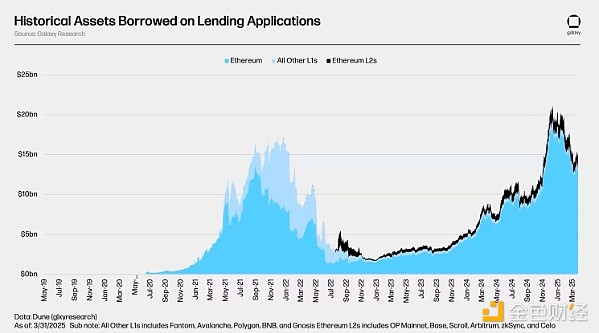
As of March 31, 2025, outstanding borrowings across the 13 chains observed in the supply analysis (including Solana, which has $1.13 billion in borrowings) are $15.33 billion. Cumulatively, this means that the utilization rate across all chains is 41.45%. On Aave V3 on Ethereum alone, there are $8.9 billion (58%) of outstanding borrowings. Across the 12 observed EVM chains, total outstanding borrowings reached an all-time high of $20.06 billion on January 24, 2022.
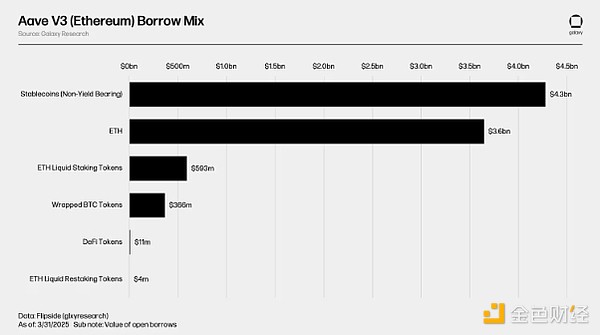
Stablecoins and non-collateralized ETH are the most borrowed assets on the Ethereum Aave V3 platform. This is because many users stake their cryptocurrencies as collateral to obtain USD liquidity to fund new transactions, while borrowing ETH with liquid (re)collateralized ETH allows users to gain leveraged exposure to ETH or short ETH at a lower net arbitrage cost. In this case, the staking yield built into the ETH-denominated liquidity (re)staking token can partially offset the cost of ETH borrowing. More details on this and other on-chain interest rates are provided below.
Interest Rates
This section details the interest rates and stability fees of major stablecoins (including USDT, USDC, GHO and DAI/USDS, as well as BTC and ETH) in on-chain lending markets and off-chain venues.
On-Chain Interest Rates
The following examines the interest rates and stability fees of stablecoins, ETH, (W)BTC, and multiple chains and on-chain lending markets.
Stablecoins
As of March 31, 2025, the weighted average lending rate and stability fee for stablecoins on the Ethereum mainnet was 5.67% calculated by the amount borrowed, using a 30-day moving average. The lending rates of on-chain stablecoins largely reflect the prices of digital assets such as Bitcoin and Ethereum. As the value of assets appreciates, lending rates generally rise, and vice versa.
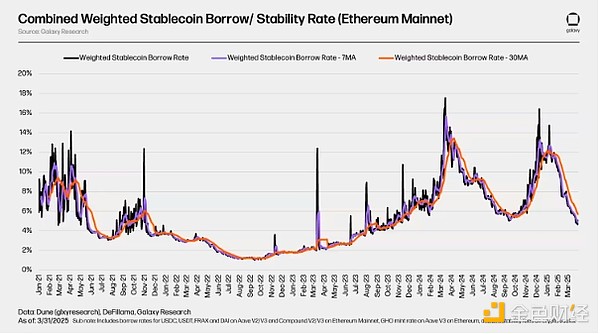
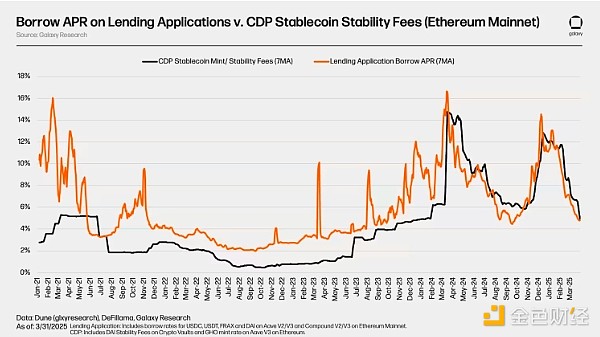
The following chart lists the annual lending rates for stablecoins in lending applications such as Aave and Compound, as well as the stability fees for CDP stablecoins such as DAI/USDS and GHO. The chart highlights the cost of borrowing LP deposits in lending applications compared to the cost of minting CDP stablecoins. It is important to note that the stability fee of CDP stablecoins is relatively less volatile than the market-driven lending rates of lending applications. This is because their interest rates are determined differently: the interest rates of lending applications are market-driven, while the interest rates of CDP stablecoins are determined through regular governance proposals or updates.
BTC
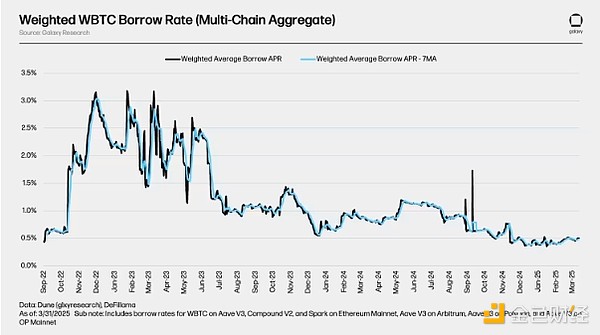
The chart below shows the weighted lending rates of WBTC on lending applications across multiple lending applications and blockchains. Due to the lower lending demand for this asset, the borrowing cost of WBTC on the chain is generally lower. As mentioned earlier, wrapped Bitcoin tokens are primarily used as collateral in the on-chain lending market, and their utilization is not high, which drives up the cost of borrowing. In addition, the cost of borrowing BTC on-chain lacks volatility, which is usually caused by users frequently borrowing and repaying debt.
In the context of borrowing BTC on-chain, it is important to note that native BTC is not compatible with blockchains that support smart contracts, such as Ethereum. Therefore, wrapped Bitcoin tokens are used in the on-chain lending market (in Ethereum, wrapped Bitcoin tokens are ERC-20 stablecoins tied to native BTC). This adds risk to on-chain BTC lending that is not common in off-chain BTC lending (which may include native BTC).
ETH and stETH
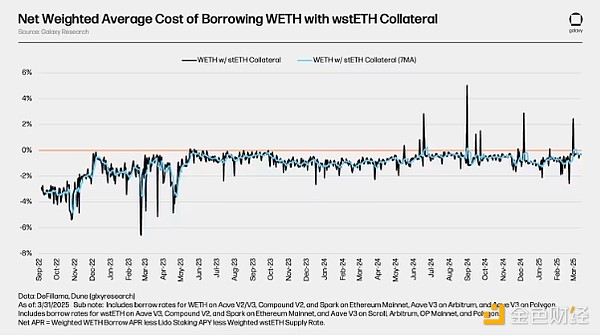
The figure below shows the weighted lending rates of ETH and stETH lending applications on multiple blockchains. Although these tokens are all centered on ETH (either directly centered on ETH or locking ETH on the beacon chain in the form of voucher tokens), there are differences between their borrowing costs. This is due to differences in interest rate curves and utilization rates for different lending applications. More on the interest rate curve mechanism will be introduced in the section that details on-chain lending applications later.
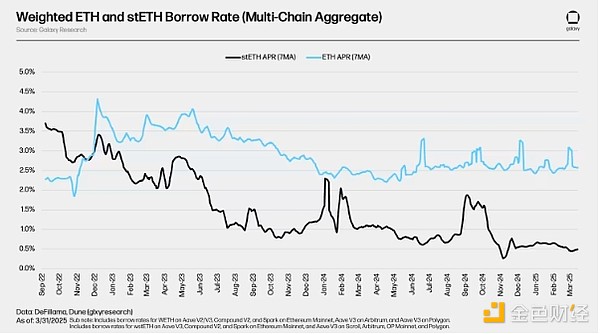
In Ethereum's largest lending market, unstaked ETH is borrowed in large quantities, and Ethereum LST has become the main collateral asset. By using LST (which can obtain the network staking annual interest rate) as collateral, users are able to obtain ETH loans at a low net borrowing rate (usually negative). This cost efficiency has spawned a circular strategy: users repeatedly use LST as collateral to borrow unstaked ETH, stake it, and then use the obtained LST to borrow more ETH in a cycle, thereby amplifying their ETH staking annual interest rate risk exposure. The accompanying figure shows the net weighted average cost of borrowing ETH using stETH as collateral, which is derived from the weighted average annual borrow rate of stETH minus the annual pledge rate of stETH and its lending supply rate.
OTC Rates
The following section focuses on the off-chain, over-the-counter lending rates for USDC, USDT, BTC, and ETH, and compares them to the corresponding on-chain rates.
Stablecoins
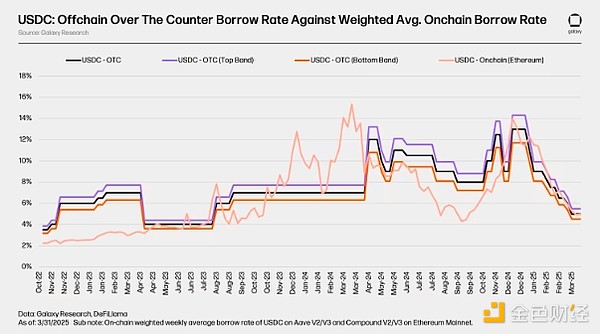
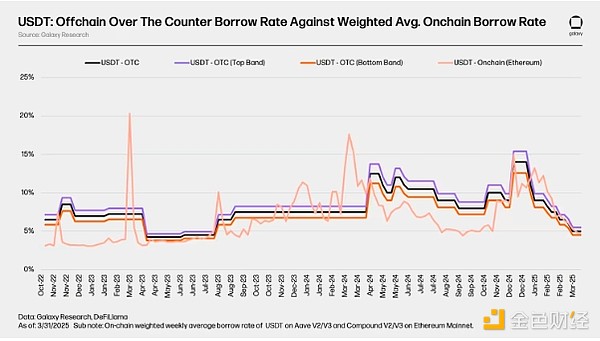
Off-chain stablecoin rates are similar to on-chain stablecoin rates, closely tracking cryptocurrency price movements and driven by leverage demand. For example, off-chain stablecoin rates bottomed out in the summer of 2023, months after the FTX crash triggered the crypto credit crunch and bear market. Off-chain rates have continued to rise since then, starting in March 2024, marking the start of the current bull run. On-chain rates, which are more volatile in nature, surged to over 15%, while OTC rates remained in the low 7% to 10% range. By the summer, both on-chain and OTC rates had normalized amid range-bound price action. Overall, on-chain and OTC stablecoin rates tend to move in tandem, with OTC rates being less volatile.
Note that the off-chain rates for USDC and USDT are roughly equal and adjust at similar cadences, while the on-chain rates are more volatile and not always equal. This is because of differences in the relative risk and utility of these stablecoins on-chain versus their use via off-chain lending and how their risk is assessed by off-chain borrowers.
USDC
USDT
Bitcoin
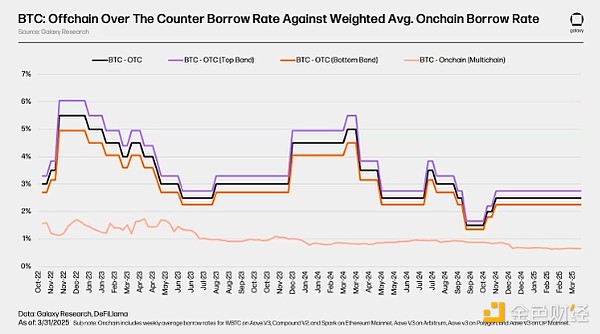
BTC interest rates show a clear difference between the on-chain market and the over-the-counter market. In the OTC market, BTC demand is driven primarily by two factors: demand to short BTC and use BTC as collateral for stablecoin/cash loans. For example, after the FTX crash in 2022, OTC market rates soared as demand to short BTC surged. Similarly, in the early days of the bull run in February 2024, OTC market rates rose as businesses sought to borrow BTC as collateral for stablecoin or cash loans. In contrast, on-chain BTC rates have remained largely flat. The on-chain market lacks significant demand, yield opportunities are limited, and most on-chain participants only use BTC as collateral for USD liquidity.
Ethereum
Off-chain ETH interest rates are usually the most stable, because the ETH staking yield provides a benchmark interest rate that the market tends to follow. On-chain ETH interest rates are usually close to the staking yield, because lenders have an incentive to lend at a price lower than the staking rate, while borrowers have limited incentives to borrow ETH due to the lack of opportunities for better returns than staking. In the over-the-counter (OTC) market, similar dynamics as BTC are also present, although less obvious. In a bear market, the demand for shorting ETH increases; while in a bull market, the demand for borrowing ETH as stablecoin collateral increases. However, in the OTC market, ETH-backed loans are less common than BTC-backed loans, as companies prefer to pledge their assets rather than use them as collateral.
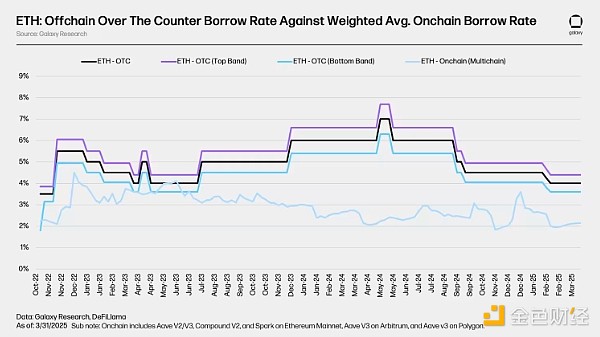
CDP Stablecoins
As of March 31, 2025, the total supply of major CDP stablecoins is $9.6 billion. Sky's DAI/USDS is the largest CDP stablecoin, with a supply of $8.7 billion, covering all collateral types (such as risk-weighted assets, private credit, and cryptocurrencies). While total stablecoin supply is near all-time highs, CDP stablecoins are still 46% below their high of $17.6 billion reached in early January 2022.
As of March 31, 2025, CDP stablecoins’ share of total stablecoin market capitalization has also fallen from a high of 10.3% to just 4.1%. This is due to the growing prominence of centralized stablecoins such as USDT and yield-generating stablecoins such as USDe, coupled with low demand for CDP stablecoins as a source of on-chain USD liquidity.
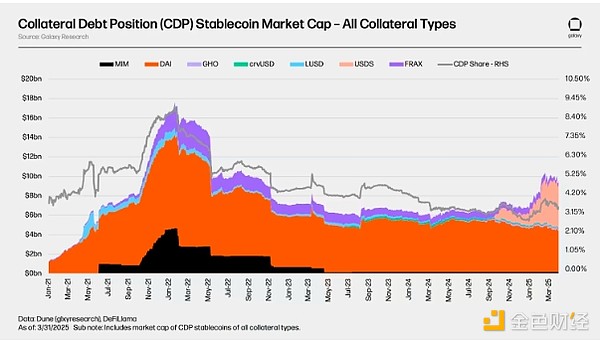
The chart below shows the crypto-collateralized market capitalization of CDP stablecoins (i.e., the market capitalization of CDP stablecoins directly backed by crypto assets). After reaching $17.3 billion in January 2022, the market capitalization of this type of CDP stablecoins has fallen 55% to $7.9 billion.
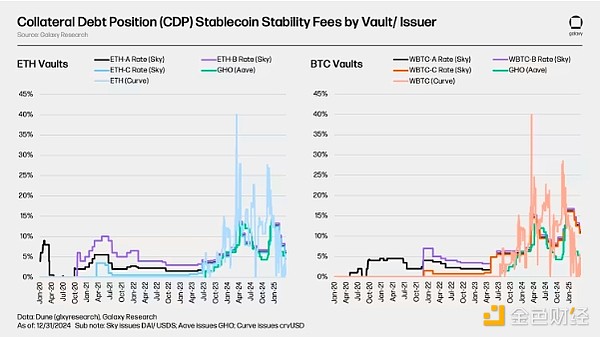
The decline in the market capitalization of crypto-collateralized CDP stablecoins from their all-time highs to the bear market in 2022-2023 is consistent with the open borrowing situation on lending applications, highlighting the similarities between their functions and uses as on-chain credit sources. The following charts show a non-aggregated view of the stability fees for CDP stablecoins in Bitcoin and Ethereum vaults. They represent the cost of minting Bitcoin and Ethereum CDP stablecoins across the observed platforms. Note that despite the assets in the ETH and BTC vaults being used as collateral to mint the same synthetic asset, there is a difference in their stability fees. This is a notable feature of some CDP stablecoins relative to their lending alternatives, where the collateralized assets, rather than the borrowed assets, determine the minting rate. More on this, and CDP stablecoins, in the section detailing on-chain lending mechanisms later.
Cryptocurrency lending DeFi and CeFi operating mechanism detailed explanation
This section covers the various verticals of CeFi and DeFi lending, how they operate, the risks involved, and how the DeFi market complements the off-chain lending business.
Why lend and borrow cryptocurrencies?
Before diving into the ways to lend and borrow cryptocurrencies, let’s first understand the reasons why businesses and individuals participate in cryptocurrency lending. Reasons include:
• Get liquidity for their tokens - Allowing borrowers to obtain liquidity without selling their assets, maintaining the potential for future gains.
• Get yield on their currency – Allows lenders to earn passive interest on their idle assets.
• Trade with leverage – Individuals can increase the size of their positions by trading with borrowed funds.
• Hedge long exposure – Enables individuals to reduce the risk of existing long positions by establishing offsetting short positions, effectively managing portfolio delta and reducing directional risk exposure.
• Gain short exposure – Enables traders to establish positions based on expected price declines by borrowing and selling assets that they expect to repurchase later.
• Financing business operations – Allows businesses to obtain working capital that can be used to fund operations.
Depending on the specific reason for borrowing/loaning, the assets owned by the borrower or lender and where they are held, as well as the amount of capital they wish to borrow or lend, will affect the best channel to use.
CeFi Lending
CeFi lending can be divided into three categories, over-the-counter (OTC), prime brokerage, and on-chain private credit.
OTC Lending
The following highlights an overview of CeFi OTC lending details:
How does it work? Counterparties connect with each other through bilateral agreements. Each transaction is negotiated and recorded separately, usually through voice or chat (such as a phone or video call, or through email or text messaging applications). The collateral of the on-chain borrower is usually held by a multi-signature authority controlled by the lender. In the case of certain three-party agreements, the borrower, lender, and custodian can each control the keys of the multi-signature authority.
Who provides and uses this service? Some of the major OTC lending institutions in this field include Galaxy and Coinbase in the United States; other large exchanges around the world also provide similar services. Borrowers are usually hedge funds, high net worth individuals, family offices, miners, and other cryptocurrency or cryptocurrency-related companies that meet the requirements of eligible contract participants (ECPs).
What are the use cases for borrowed funds? Once a loan is issued, the borrower is typically free to spend the proceeds of the loan. Some common uses include leveraged trading, financing operations, or refinancing other loans.
Other details of OTC lending: Some OTC lenders use on-chain applications to supplement their operations. This facilitates transparency and accounting of their books, enables them to operate 24/7, conduct clearing and any scheduled operations, and build products on a free and open infrastructure.
OTC lending for individuals and small businesses: While institutional-level activity is the main driver of the OTC lending market, individuals and small businesses are also active in the space. Some CeFi lenders, such as Ledn, Unchained, and Arch, serve individuals who want to use cryptocurrencies as collateral, such as for home purchases and starting businesses. Such customers are typically unable to obtain financial services from traditional banks, which currently do not accept digital assets as collateral. Therefore, these lenders act as a lifeline for such borrowers, who are often rich in digital assets but not necessarily in fiat currency.
Prime Brokerage
The following highlights a detailed overview of traditional CeFi prime brokerage:
How does it work? Firms that open accounts with prime brokers can take directional positions on cryptocurrency ETFs. ETFs are limited by type and issuer, and only Bitcoin ETFs issued by specific institutions can accept collateral. Typically, only 30-50% margin is required to maintain a position. Positions are usually marked to market daily and margin calculations are performed daily.
Who provides/uses it? Institutions such as Fidelity, Marex and Hidden Road provide traditional prime brokerage services for cryptocurrency ETFs.
What are the uses of borrowed funds? Usually for trading or short-term financing (open-ended).
Crypto Prime
Similar Prime services provided by cryptocurrency ETFs also apply to spot cryptocurrencies. However, only a few platforms (such as Coinbase Prime and Hidden Road) provide such services. Spot Crypto Prime broker services are set up similarly to traditional services for ETFs, with the main differences being more conservative margin requirements and loan-to-value (LTV) ratios.
On-chain private credit
Exploding in popularity in 2021, on-chain private credit allows users to pool funds on-chain and deploy them through off-chain protocols and accounts. In this case, the underlying blockchain effectively becomes a crowdsourcing and accounting platform for off-chain credit needs. cDeFi companies have been the main drivers of such loans, managing both the on-chain and off-chain ends of the loan lifecycle—often in collaboration with off-chain partners. On-chain operations include launching smart contracts, designing tokens for each loan, and running the infrastructure required to support on-chain applications. Off-chain operations include attracting borrowers, establishing the necessary legal channels to raise on-chain funds, and establishing the processes and infrastructure required for funds to be transferred on/off-chain.
The uses of the proceeds are generally narrow, ranging from corporate startup funds to real estate bridge loans and treasury funds, with loan terms set on a borrower-to-borrower basis. Historically, stablecoins have been used primarily for such applications. The off-chain portion of these products presents unique risks, including the auditability and transparency of loan funds raised on-chain, as well as the performance of the loans themselves. In some cases, the lack of or difficulty in auditing off-chain funds has led to problems with borrowers misusing loan funds for purposes outside the scope of the loan agreement.
Private Credit and Stablecoin Collateral
On-chain private credit is uniquely applied in DeFi as yield-generating stablecoin collateral, where off-chain debt and interest backs on-chain stablecoins. This model is most common between Sky and Centrifuge, an on-chain private credit and RWA issuer. Sky allocates a portion of DAI/USDS to allocators on Centrifuge, who use these stablecoins for off-chain structured credit products, real estate financing, and other applications with investment-grade ratings. Allocators then pay the Sky protocol with the DAI principal issued to them and the interest earned on their off-chain debt protocols. This model of backing on-chain assets with off-chain debt is not dissimilar to the traditional collateralized debt position (CDP) stablecoin model, where on-chain debt is used as collateral for the stablecoin.
DeFi Lending
Some lending products and services that exist through off-chain channels also exist in the form of permissionless smart contract applications. Notably, lending applications like Aave, and collateralized debt position (CDP) stablecoin issuers like Sky, allow users to borrow and lend against on-chain assets as collateral. Alternative ways to obtain on-chain credit, such as perpetual contracts dexes, allow users to obtain funds based on personalized needs (such as leveraged trading). While providing similar services, the on-chain nature of lending applications and the way other credit is obtained on-chain make them different from centralized off-chain alternatives in a number of key ways. The table below highlights some of these differences:
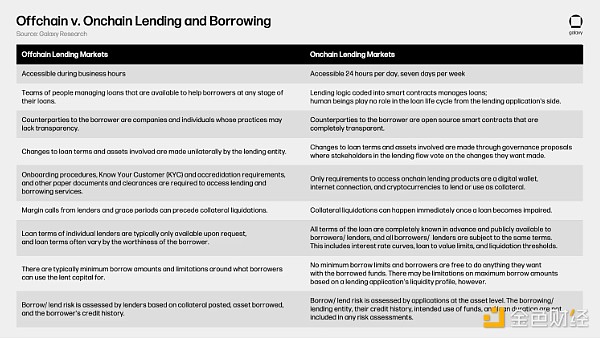
How does DeFi lending work?
DeFi lending functions similarly to secured off-chain lending. The main differences are: 1) DeFi lending is run programmatically through smart contracts, executing a pre-set set of parameters rather than a manually guided process; 2) borrower risk is insured by the borrower; and 3) risk compensation measures are adopted (such as lender returns and liquidator rewards).
These parameters, including interest rate curves, loan-to-value ratios, liquidation thresholds, etc., are designed at the asset level to manage risks, establish incentive mechanisms, and promote maximum efficiency in the loan market.
Setting risk guardrails through asset parameters means that on-chain and off-chain lending differ in where and how risk is ultimately covered. Risk in off-chain lending is covered on a borrower-by-borrower basis through factors such as loan-to-value (LTV) and interest rate, taking into account the borrower's history, collateral/borrowed assets, and loan term. On-chain lending, on the other hand, assesses risk based entirely on the combination of collateral/borrowed assets. That is, every borrower using the same collateral and borrowed assets will have the exact same loan in terms of loan-to-value, interest rate, and all other parameters. This is because the users, their ability to repay the borrowed funds, and the loan term are not what pose an existential threat to the functionality of the application or the lender's capital. The real threat is the collateral assets they provide and the assets they borrow, because in the event of loan impairment, collateral liquidation will keep the lender and the application intact.
Each parameter is completely transparent and known in advance, and they apply to one or more of the three steps of the DeFi lending process:
The following is a deep dive into the life cycle of DeFi loans from the perspective of asset parameters and risk management measures for managing DeFi loans.
Deposit collateral assets
In fact, all lending activities in DeFi are over-collateralized. This requires users to pre-collateralize some assets as collateral for borrowing. These collateral assets are locked on the application during the borrowing period and lent to the borrowing user, thereby maximizing the efficiency of all funds on the application. The user's choice of collateral asset determines the following parameters, which vary by asset:
• Supply Annual Percentage Rate (APR) – The rate of return that users receive for depositing collateral, as a function of the borrowing annual percentage rate (APR). The rate of return generated by these deposits is the interest paid by borrowers. This rate of return is in addition to the native rate of return of the provided collateral asset (e.g., the staking yield for stETH). The riskier an asset is perceived by the application to be, the higher the ratio of the supply APR relative to its utilization. This is done to compensate suppliers for the risk they take on, and to manage the application's risk in terms of borrowing/liquidity functions.
• Loan-to-Value Ratio (LTV) – The maximum relative value a user can borrow for their collateral. For example, if the collateral asset has an LTV of 50%, a user can borrow a maximum of 50 cents for every dollar of collateral deposited. The lower the LTV of a particular collateral asset, the riskier it is perceived by the application to be, and vice versa.
• Liquidation Threshold - When a user's loan-to-value (LTV) reaches this threshold, their collateral will be liquidated and returned to the lender/liquidator. The liquidation threshold is always higher than the maximum LTV. Typically, the volatility and risk of the collateral asset is directly related to the spread between its maximum LTV and the liquidation threshold. This is done to create a safety buffer to prevent immediate liquidation when borrowing at the maximum LTV.
• Liquidation Penalty - Expressed as a percentage of the liquidated asset amount, the liquidation penalty is a reward paid to the entity that liquidates the user's collateral. The liquidation penalty is also known as the "liquidation spread" because it represents the percentage discount that the liquidator can enjoy when purchasing the user's collateral. For example, if a user holds liquidable collateral with a market value of $100 and a penalty of 5%, the liquidator can buy it at $95 and then sell it at market value, pocketing the difference. Lending applications typically take a fee from the reward. Some lending applications use auctions instead of hard-coding liquidation penalties, letting the market determine the appropriate discount. The higher the liquidation penalty for a collateral asset, the riskier the application considers it. This is done to adequately incentivize liquidation of collateral and limit the likelihood of bad debts.
• Supply Caps - Some lending applications have strict deposit limits on collateral assets that are designed to limit users' exposure to that asset. A supply cap can limit the amount of a certain collateral asset that a user can deposit. A low supply cap may be due to the risk profile of that asset and the application is limiting its exposure to it. It may also be a sign that the market cap of the asset is relatively small and the application does not want users to deposit more than a certain percentage of its total value.
• Collateral Weights and LTV Multipliers - Factors applied to the value of a depositor's collateral, limiting the extent to which it can be used for risk aversion or entitles them to a higher maximum loan-to-value ratio (LTV), which in turn increases the threshold for liquidation. Assets that the application considers riskier are weighted less than 1 to create a buffer between their market cap and the share they can use to borrow. For example, a collateral worth $100 with a weight of 0.85 has a borrowing capacity of $85 and the maximum loan-to-value (LTV) is applied to that collateral. Collateral<>Borrow a borrowing asset pair, and if the lending application finds that its value correlation is high (for example, borrowing ETH with Ethereum LST), the user is entitled to a preferred maximum loan-to-value (LTV) ratio because the collateral and borrowing assets are unlikely to appreciate or depreciate quickly. LTV multipliers and collateral weights are only applicable to specific assets and not all lending applications use them.
• Segregated Status - Assets in segregated status cannot be paired with other collateral assets for lending. In addition, the amount of collateral assets in segregated status can be borrowed is subject to a specific debt ceiling, which limits its lending scope. In other cases, segregated status means that only one asset can be borrowed, and once borrowed, no other assets in the user's portfolio can be borrowed. In applications that use collateral weights, segregated assets have a weight of 0. Segregated assets are a tool that allows emerging or volatile assets to be introduced to lending applications in a risk-averse manner; it also allows applications to custody a wider range of assets while compensating for the risks of doing so.
The specific set of parameters that control collateral assets and their precise values vary by application, blockchain, and asset. For example, USDC on OP Mainnet Aave V3 has different parameters than USDC on Ethereum because they are two different tokens (held at different token contract addresses on different blockchains) and exist in different ecosystems; MarginFi on Solana uses collateral weights to manage risk, while Aave does not.
These parameters are all enforced by algorithms and only vary with the combination of collateral/borrowed assets. That is, from the application's perspective, all operations, especially the execution of parameters and the necessary accounting and distribution of collateral returns, are done autonomously through smart contracts; and every user who deposits the same collateral asset/borrows the same asset is subject to the same predetermined parameters. Credit scores, values, and other off-chain indicators used to obtain loans are not used because the application itself is not subject to any constraints and only requires depositing collateral to borrow. The same principles apply to borrowed assets. However, the networks on which these applications reside may introduce scrutiny factors that are not relevant to DeFi lending itself (e.g. OFAC sanctions).
The “quality” and risk of the underlying collateral assets that determine their parameter values are assessed through a number of factors, including but not limited to the following [ 1 ] [ 2 ]:
• Asset liquidity/market depth and time to restore market depth
• Asset price volatility
• Asset market capitalization
• Counterparty risk (how and by whom the asset is managed)
• Smart contract risk (the integrity of the underlying code of the asset)
• Liquidator execution ability (how quickly a designated liquidator can liquidate an asset)
• Oracle confidence in its collateral asset pricing
Similar risks of the collateral assets outlined by a specific loan application also determine the parameters of a borrowed asset, which will be covered in the next section.
Choosing a Borrowed Asset
Once a user has deposited collateral, they can choose the asset to borrow. To mitigate risk, some collateral and borrowed asset pairs are set up as fixed markets (such as Compound V3 and Aave’s Lido market), where the collateral provided can only be used to borrow a single asset or a specified collection of assets in an isolated pool; others are free-range, where any collateral asset can be used to borrow any asset on the application. Borrowers are free to use the borrowed assets for any purpose and have full ownership of them. The assets a user borrows determine any combination of the following four components:
• Borrowing Annual Percentage Rate (APR) – The nominal annualized cost of borrowing a specific asset. The interest paid by the borrower is shared by the lending application (in the form of a reserve requirement) and the user who deposited the borrowed asset (in the form of a supply APR). In some applications, users can choose between stable rate loans, where the interest rate paid is fixed in the short term but can be rebalanced in the long term based on changing market conditions, or floating rate loans, where the interest rate paid fluctuates in real time with the market. The vast majority of on-chain borrowing is floating rate loans, as fixed borrowing rates are typically much higher than floating rates, and some applications do not offer fixed rates. All users borrowing the same asset pay the same interest rate, which is determined by the application's perceived risk of the borrowed asset and the market demand for that asset. Assets that the application deems riskier will have a higher borrowing curve, and vice versa. Lending applications use their assessment of the potential risk of a particular asset to determine the interest curve.
• Reserve Factor - The share of interest paid by a borrower that is allocated to the lending application, its DAO (decentralized autonomous organization), or other funds maintained by the application. It is expressed as a percentage of the interest paid by the borrower.
• Liability Weight - A factor applied to the value of a depositor's collateral to limit how much can be borrowed against their collateral. For example, if the borrowed asset is worth $100 and the debt weight is 1.15, the borrow value is $115, which is factored into the loan-to-value ratio (LTV). This factor can be used as a risk mitigation tool to assess borrowed assets that are considered risky for a loan application.
• Borrowing Caps - Some lending applications have hard limits on borrowed assets that are intended to limit a user's risk exposure; this is done for liquidity management and to mitigate bankruptcy risk. Hard borrowing caps can limit the amount of assets a user can borrow if liquidity is insufficient. Other applications have "soft" borrowing caps, where the borrowing limit is only constrained by the amount of assets provided to the protocol. In this case, the protocol supports an unlimited supply and borrowing of assets, but users can only borrow as much as there is sufficient supply and liquidity for the asset. Hard borrowing caps are typically lower than their corresponding supply caps, and can never be higher. It is important to note that borrowing caps are typically global, not per-user (i.e., a single user can borrow up to 100% of an asset's available liquidity or borrowing cap, provided they have collateral. Applications typically do not limit the size of a single borrow).
These components are all based on the lending application’s perceived risk of the borrowed asset, its target liquidity level, the relative returns to borrowers and the application itself, and its lending cost positioning strategy against competing applications in the same market. The risk of borrowed assets, the specific set of parameters that control these risks, and their precise values vary by application, network, and asset.
Calculating on-chain interest rates
There are two key factors that affect the interest rate paid by on-chain borrowers: 1) utilization and the best rate; and 2) the slope calculation of the interest rate curve. These two factors vary by asset and lending application. For example, the best rate and interest rate curve for WBTC on Aave V3 on Ethereum are different from those for USDC; the borrowing rate curve for USDC on Aave V3 on Ethereum is also different from the borrowing rate curve for USDC on Aave V3 on OP Mainnet.
Utilization and Best Rates
The utilization rate of the on-chain lending market reflects the relative liquidity of assets within the application. It is typically calculated as demand/supply, where demand is the amount of the asset being borrowed and supply is the amount of the asset deposited into the protocol (including collateral deposited by borrowers). Direct liquidity of an asset expressed in USD or national units is simply supply-demand. In some cases, the supply side of these calculations will include reserves or other factors unique to a particular protocol. Therefore, a high utilization rate indicates low relative liquidity, because the more assets that are borrowed, the less funds are available in the application for withdrawals, liquidations, and additional borrows, and vice versa. The utilization rate is used to determine the precise interest rate that users pay along the asset's interest rate curve, with the higher the utilization rate, the higher the interest rate. The interest rate paid can also fluctuate in real time as supply and demand change. Changes in the interest rate can be made in units of network block intervals (the time it takes for new blocks to be added to the chain) or the frequency with which users supply/repay and borrow assets.
The optimal rate or inflection point rate (sometimes shown as inflection point) is the utilization rate above which the slope of the interest rate curve becomes steeper and the borrow rate calculation changes. It determines the slope of the borrow curve, which is also the target utilization (or relative liquidity and interest rate target) for a given asset. More volatile, less liquid assets have lower optimal rates, and the goal is to reduce utilization to ensure that the application has sufficient liquidity. When utilization > optimal rate, the borrow curve becomes steeper to incentivize deposits and loan repayments (increasing supply and reducing demand) and disincentivize new borrowing (limiting net new demand), thereby reducing utilization to the target rate. When utilization < optimal rate, the borrow curve becomes flatter to incentivize borrowing and increase utilization to the target rate without pushing the rate too high through new incremental borrowing.
Interest Rate Slope Calculation
Each lending application has a unique interest rate determination equation that varies based on perceived asset risk and asset type [ 1 ], but they are all affected by utilization and the optimal rate, and become steeper after actual utilization exceeds the optimal rate. Lending applications typically have multiple interest rate curves for each asset type to compensate for their various risks. For example, an application could have a low rate curve and a high rate curve for USD stablecoins, depending on how it views the risk of each stablecoin. Here are some benchmark equations used to construct rate curves for some lending applications:
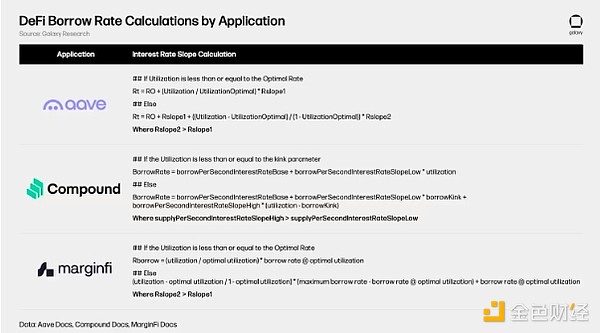
These borrow rate equations roughly take the shape of the example curves below. Notice how the slopes above and below the optimal rate are represented by different lines. This is because a different slope equation is used to calculate each slope equation.
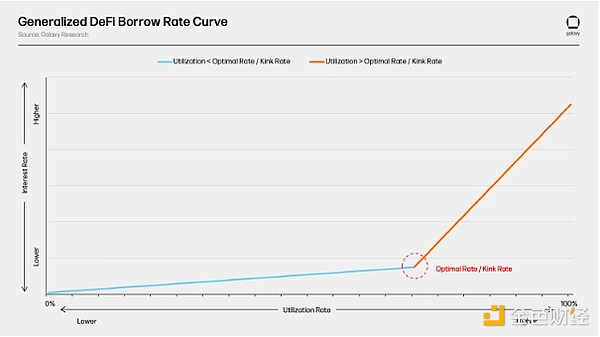
The flat and steep segments of the interest rate curve combined with the optimal utilization rate form a self-regulating mechanism that autonomously manages relative protocol liquidity/lender income and capital efficiency of deposits through incentive-driven. Protocol liquidity and lender income are maintained by the target share of deposit assets borrowed (optimal interest rate), which is enforced through a dynamic interest rate curve. Assets with higher risk of liquidity shortage will have a very steep curve, exceeding the optimal interest rate, to fully compensate for this dynamic change. Therefore, in on-chain lending, interest rates are a tool for liquidity management, risk compensation, and capital efficiency management. All other parameters are used to balance the application's exposure to specific assets, limit the potential for bad debt accumulation, mitigate the risk of failing to liquidate user collateral (or at the expense of borrower or lender funds), and manage other risks.
Repaying Loans and Liquidations
The final step in the on-chain lending process is to repay the loan and, in the worst case, liquidate.
Repaying Debt
All debt is repaid in the borrowed asset. For example, the principal and interest on a USDC loan must be paid in USDC, and so on. In addition, the loan term is indefinite for as long as the borrower needs it, and there is no fixed principal and interest repayment schedule; users are free to choose to repay their debt at any frequency or amount. However, all loans accrue interest based on the outstanding borrowed amount, which, together with fluctuations in the relative value of collateral and borrowed assets, affects the health of their debt.
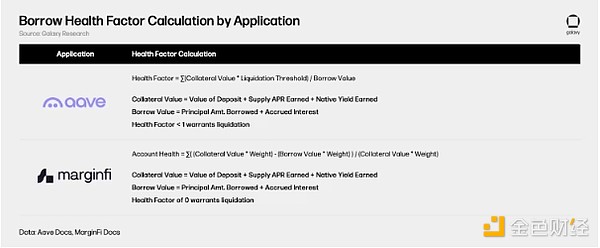
The health factor is a measure of the borrower's risk of liquidation. It is derived based on the parameters of the borrower's collateral and borrowed assets, using the value of the borrowed asset plus the accrued interest relative to the value of the borrower's collateral. In the volatile cryptocurrency lending environment, this is an important consideration as borrowers may be liquidated if the value of their collateral plummets relative to the borrowed asset, but they may also be liquidated if the value of the borrowed asset rises relative to the collateral. In both cases, the value of the collateral is not sufficient to ensure that the loan is adequately collateralized. For most applications, a health coefficient of 0 or 1 will result in liquidation. The table below highlights how Aave and MarginFi calculate the health of a loan.
The native yield of the collateral asset and/or the annual supply percentage rate (APR) of the lending application are factored into its value. For example, the value of a user's stETH collateral benefits from the staking yield natively earned on the Liquidity Staking Token (LST), in addition to the annual supply percentage rate (APY) from interest payments on borrowed stETH. This helps keep the value of the collateral more dynamic relative to the borrowed asset and introduces an element of capital efficiency to the user's collateral.
Liquidation
If a borrower's debt is impaired and their health factor reaches the liquidation point, their collateral will be liquidated. Here is an overview of how liquidation generally works in DeFi lending applications:
There is $1 million USDC on a lending protocol. A borrower wants to borrow some of the USDC provided to the application with their idle ETH. In this example application, the maximum LTV of ETH is 75%, the liquidation threshold is 80%, and the liquidation penalty is 10%. Given these details, the user borrows 90,000 USDC from the app with 120,000 USDC of ETH as collateral, at a LTV of 75%. This means that there is 910,000 USDC remaining on the app, the total outstanding borrowing is 90,000 USDC, and the borrower has deposited 120,000 USDC worth of ETH.
The USDC price of ETH drops, causing the value of the user's collateral to drop to 112,500 USDC, reaching the 80% liquidation threshold. This triggers the liquidation process, transferring ownership of the user's collateral to the lending app.
The app then opens up 112,500 USDC worth of ETH to the liquidator, who purchases this ETH for 101,250 USDC, where the delta represents the 10% liquidation penalty allocated to the ETH collateral. After this, the user's ETH collateral is removed from the application and distributed to the liquidators, and the proceeds from the liquidation are added to the remaining 910,000 USDC balance in the application. This effectively pays off the outstanding debt, fully funds the lender, and removes the corresponding collateral from the application. The borrowing user retains the 90,000 USDC they originally borrowed.
Finally, the application has 1,011,250 USDC (1,000,000 USDC initially deposited - 90,000 USDC borrowed + 101,250 USDC from liquidation) and X - 120,000 USDC worth of ETH because the borrower's collateral was sold to the liquidator.
Note that for ease of explanation, this example assumes that the borrowing user's collateral is 100% liquidated and their loan is 100% repaid. Some applications do not allow this and place caps on the amount of a loan that can be repaid in a single liquidation event. Additionally, some applications do not claim ownership of collateral prior to liquidation, allowing liquidators to purchase user collateral directly on the open market when a loan is impaired.
Alternatives to On-Chain Credit
Lending applications are not the only source of native on-chain credit. Collateralized Debt Position (CDP) stablecoins and perpetual swaps (perps dexes) provide users with multiple ways to access credit for a variety of purposes.
Collateralized Debt Position Stablecoins
Collateralized Debt Position (CDP) stablecoin issuers extend credit through a mechanism similar to lending applications, enabling users to access liquidity with idle funds. Like loans issued through lending applications, CDP stablecoin borrowers are accounted for risk based on their collateral assets. However, rather than using existing assets deposited by users to service borrowers, they mint a synthetic asset (usually a USD stablecoin) based on the collateral provided. This creates an asset that is effectively backed by the value of the debt assumed by the collateral provider. The following diagram highlights the difference between CDP stablecoins and lending applications in terms of issuing credit:
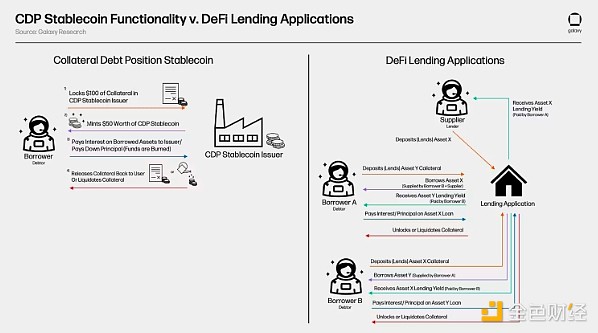
Sky's USDS and DAI and Aave's GHO are examples of CDP stablecoins. The issuance of Aave's GHO stablecoin follows the parameters and process of DeFi lending described above. It leverages the application's collateral pool and designation mechanism and the existing lending market infrastructure to mint new GHO units based on the borrowing user's collateral. While Sky's
 Weatherly


