Original: Liu Jiaolian
Yesterday evening, a prophecy came true: 1. "The US government transferred about 10,000 BTC confiscated from Silk Road to the exchange", 2. "Each of the first two (transfer operations) caused a retracement of about 5%." This morning, BTC opened high and fell, falling from 59.7k to the lowest 56k.
Last night, the internal reference Jiaolian also drew a 30-day Pearson correlation coefficient chart of BTC and gold, S&P 500 and Nasdaq. The so-called Pearson Correlation is the quotient of covariance and standard deviation. When the correlation coefficient is equal to 1, it is a perfect positive correlation; when the correlation coefficient is equal to -1, it is a perfect negative correlation; the closer the correlation coefficient is to 0, the weaker the correlation.

Jiaolian pulled out this chart to respond to the question about BTC's recent trend similar to the Nasdaq. Through the calculation of data, we can see that the two are not always positively correlated; it is not a period of strong correlation at present.
Somewhat counterintuitive. Our eyes often deceive us, and at this time we often need to use mathematical and statistical analysis tools to help us get a more objective and real picture.
Regarding the saying that BTC follows the US stock market, Jiaolian vaguely remembers that it has been rampant since 2021. Since then, Jiaolian has mentioned from time to time in articles and internal references that BTC will not be strongly correlated with US stocks in the long run, and all observed correlations are only short-term temporary phenomena.
However, too many people still easily draw the conclusion that BTC and US stocks are related based on their naked eye observations and unreliable memory. Of course, since this fallacy is so common and deeply rooted that it cannot be eliminated by popular science, this cognitive difference may be enough to constitute an investment disadvantage, allowing those who overcome this bias to earn excess profits from them.
Recently, Uniswap Labs consultants, Copenhagen Business School researchers, and Circle researchers jointly published a research paper titled "What drives the price of crypto assets?" [1].
Although it is called a crypto asset, the main object of the paper is BTC. After all, other altcoins died too quickly, and there is simply not enough sufficient and continuous data for research.
The paper uses the vector autoregression model (VAR) to analyze three main price impact factors:
1. The impact of traditional monetary policy - In fact, it is mainly the monetary policy of the Federal Reserve, such as balance sheet expansion and contraction, interest rate hikes and cuts
2. The impact of traditional risk preference - This is mainly the U.S. stock market; it is generally believed that the rise of U.S. stocks reflects the increase in market risk appetite, and the decline of U.S. stocks reflects the decrease in risk appetite; while the U.S. dollar and gold are the opposite, reflecting the risk aversion
3. The impact of specific crypto demand - The unique risk preference for crypto assets themselves, which has nothing to do with other assets
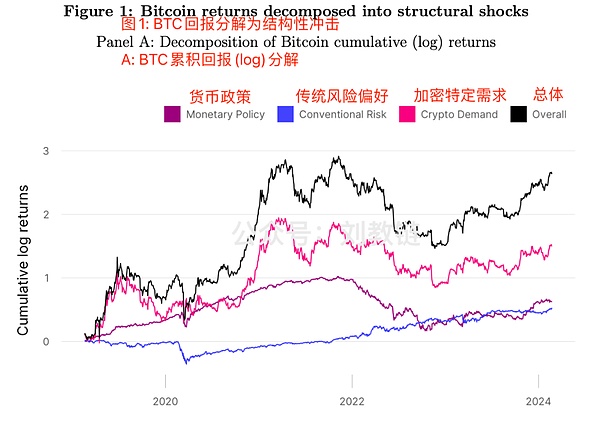 It can be clearly seen from the figure that the risk preference factors related to US stocks have the weakest driving force on BTC prices, followed by macro monetary policy, and the strongest driving force is still crypto-specific demand.
This research conclusion inadvertently confirms the content arrangement of the teaching chain internal reference, which is quite scientific and reasonable. In each issue of the internal reference of the teaching chain, the teaching chain will take the unique information of the encryption industry as the absolute focus and main body, analyze, judge and comment on it; the second focus, which is also the first part of each internal reference, will compile and report the latest macro factors, mainly the monetary policy of the Federal Reserve, the US dollar index, gold, etc.; occasionally, some information about US stocks will be mentioned, but the frequency is basically not high.
Through this study, we may also see why we should pay attention to the monetary policy of the Federal Reserve. Because macro risk shocks can also become the strongest driving factor at certain times. For example, in the second half of 2022:
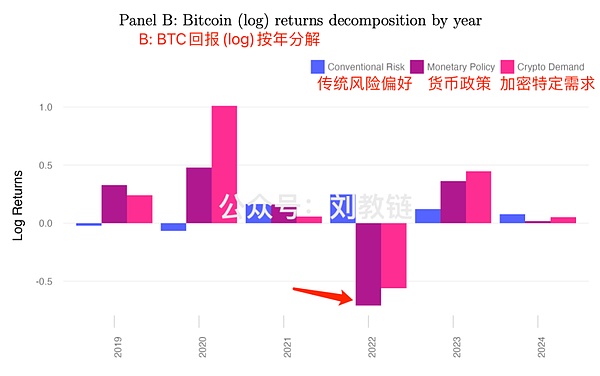
Looking back at the second half of 2022, the Federal Reserve raised interest rates at an unprecedented speed, and the combined reduction of the balance sheet has created the feat of BTC falling below the "pre-2017 high" of 20,000 US dollars and the lowest bottom of 16k!
From this study, the main "culprit" is related to the deleveraging factors of the crypto market itself, such as Luna/UST crash and FTX bankruptcy, but the biggest influencer is the rapid tightening of the Federal Reserve.
In this way, when the Federal Reserve is about to end the tightening cycle in the second half of this year and restart the easing cycle, is the next big bull market of BTC already on paper?
According to the latest disclosure of the US SEC documents, major US asset management institutions such as Goldman Sachs and Morgan Stanley have already built positions in BlackRock's spot BTC ETF products and actively laid out the next crypto bull market.
With the successful listing of BTC ETFs of institutions such as BlackRock, the US government has turned to crypto-friendly, and the driving factor of crypto-specific demand will also play an important role in fueling the bull market.
Juan Leon, senior investment strategist at Bitwise, said[2] that for long-term investors, when the U.S. stock market is liquidated and plummeted, it is a great time to add BTC (rather than gold) when the market falls.
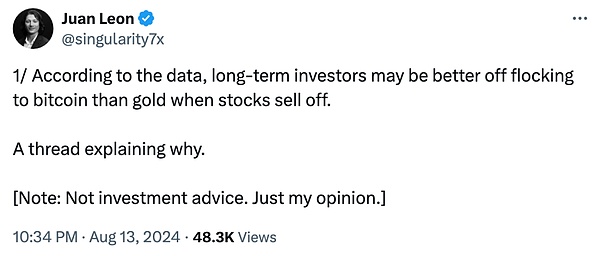
He analyzed the correlation between BTC and U.S. stocks and came to the following two conclusions:
First, BTC is not a good short-term hedging tool for U.S. stocks.
This means that when U.S. stocks fall, BTC does not always rise, thus showing a risk-averse feature. Sometimes, it does not move; sometimes, it also falls.
This review is actually in line with the research conclusion introduced by the above teaching chain, that is, the short-term correlation between BTC and U.S. stocks is actually very low.
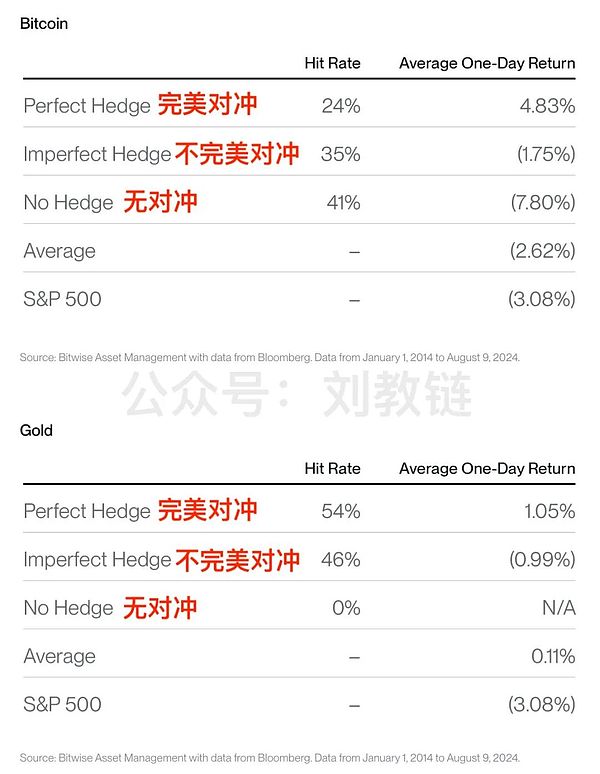
From the data in the above table, gold is more like a short-term hedging tool for US stocks.
Second, if you extend the time, adding BTC to the market when it falls will always give you a surprise.
For example, if you add BTC to the market when the S&P 500 retreats by more than 2%, the average return rate after holding it for one year can reach an astonishing nearly 190%. If you implement the same strategy of adding to gold when it falls, the average return rate in one year is only less than 8%, which is even worse than the 23% of adding to the S&P 500 index itself. See the table below:
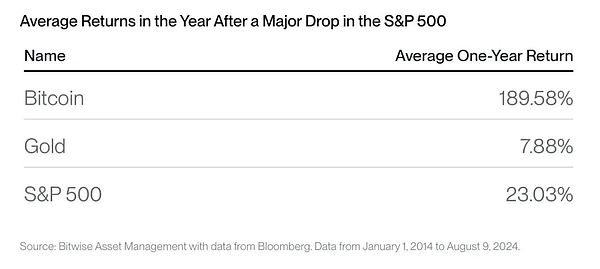
Friends all know "add to the market when it falls". However, the original meaning of adding positions when the market falls refers to adding additional positions when BTC plummets. After reading Juan Leon’s analysis, Jiaolian got an inspiration. It turns out that you can also add BTC positions when the US stock market plummets, so that the eight-character formula of adding positions when the market falls can be turned into a hedging strategy.
From this perspective, BTC can be regarded as a long-term hedge against US stocks.
- [1] https://papers.ssrn.com/sol3/papers.cfm?abstract_id=4910537
- [2] https://x.com/singularity7x/status/1823367443865014630
 JinseFinance
 JinseFinance
 YouQuan
 Bitcoinist
 Bitcoinist
 cryptopotato
 Catherine
 Bitcoinist
 Cointelegraph
 Cointelegraph