Author: Xiaoxiang
Fifty days have passed since Trump returned to the White House as the 47th President of the United States. In the first 50 days of Trump 2.0, the global financial market undoubtedly once again deeply felt the power of this "King of Understanding". His policy proposals on tariffs, immigration, spending cuts and other policies have triggered a series of turmoil in the global market.
It can be said that from "Trump 1.0" to "Trump 2.0", global asset prices have been constantly rewriting the script in the process of fiscal stimulus, industrial game and monetary credit reconstruction. So what kind of market fluctuations have occurred in major asset classes around the world in the past 50 days? What are the similarities and differences compared to Trump’s 1.0 term?
According to the multi-asset trend comparison chart compiled by Fundstrat, the differences in fiscal policy, trade stance and regulatory environment during US President Trump’s two terms in office (“Trump 1.0” in 2017 and “Trump 2.0” in 2025) have significantly affected the volatility trajectory of global risky assets and safe-haven assets.
Below is a comparison of the trends of the S&P 500, Russell 2000, Bitcoin, 10-year Treasury yield, US dollar index, gold price, Germany's DAX and China's CSI 300 during this period.
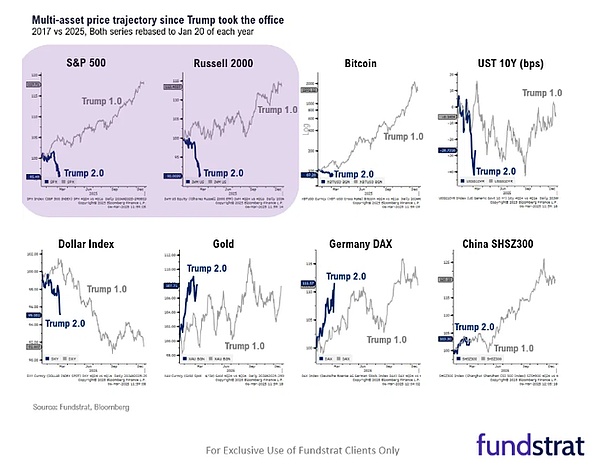
Note: They are S&P 500, Russell 2000, Bitcoin, 10-year Treasury yield, US dollar index, gold, German DAX index and CSI300.
It is not difficult to see that:
Eight years ago and now, the biggest market differences across asset classes appeared in US stocks and Bitcoin.
In the big picture, the 10-year U.S. Treasury yield, the U.S. dollar index, the gold price, the German DAX index and the Chinese CSI 300 index are actually similar to those eight years ago.
Especially the CSI 300 Index, among the eight groups of comparisons, the performance of Trump’s first 50 days in office was most similar to that of eight years ago. It should be noted that in the first year of Trump 1.0 (January 20, 2017 - January 19, 2018), the cumulative increase of the CSI 300 Index actually reached a staggering 28%.
U.S. stocks and Bitcoin are no longer the same
According to statistics from Dow Jones Market Data, the U.S. stock market has now recorded its weakest performance in the first 50 days of a president since 2009, when Obama took office during the global financial crisis.
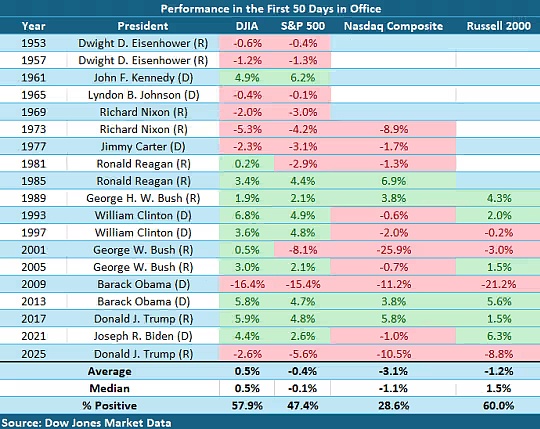
As of Monday's close, the S&P 500 had fallen more than 6% since Trump took office. The Nasdaq has already entered the 10% high correction zone, and the Dow Jones Industrial Average has fallen by nearly 3% since January 20.
History shows that U.S. stocks tend to fall during the first 50 days of a president's term. Since 1953, the S&P 500 has averaged a negative 0.4% return during this period, while the Nasdaq has averaged a 3.1% loss during those 50 days.
However, it is still extremely rare for U.S. stocks to perform so poorly as in the first 50 days of Trump 2.0. This is also in stark contrast to the stock market performance during its first period: According to Dow Jones Market Data, in the first 50 days of Trump 1.0, the S&P 500 rose 4.8%, while the Nasdaq rose 5.8% and the Dow rose 5.9%.
As investors flee almost all types of risky assets, concerns about a recession are now further sweeping Wall Street, and the steady decline in U.S. stocks accelerated sharply on Monday. There is growing concern that Trump's plans for higher tariffs, spending cuts and geopolitical turmoil will tip the U.S. economy into stagnation or even recession. Even until recently, the U.S. economy has been strong enough to defy worrywarts.
Will Compernolle, macro strategist at FHN Financial, said, "If the owner of the White House himself is not very optimistic about short-term growth expectations, then why should the market be optimistic about this? If they are willing to ignore what they think is short-term pain - detoxification, then the greater risk is that after detoxification, they will not be able to prevent the economic downturn before it is too late."
Of course, the decline of U.S. stocks after Trump took office is obviously also related to the continuous liquidation of the "Trump trade" that was popular before and after last year's election. Just weeks ago, investors were cheering Donald Trump’s return to the White House, betting his combination of tax cuts and tariffs would spur economic growth, boosting U.S. stocks and the dollar and weighing on markets elsewhere — the so-called “Trump trade” was all the rage. Today, however, that sentiment is fading fast.
Bitcoin, which is also a high-risk asset, has also suffered a similar suppression as the U.S. stock market. On Monday, Bitcoin fell below the $80,000 mark, which was in stark contrast to its trend at the beginning of Trump's 1.0 term.
A-shares and European stocks are "bull-like"
Of course, although at the beginning of Trump’s two terms, the trends of U.S. stocks and Bitcoin showed significant differences. But there are also many trends across asset sectors that have similarities with those at that time.
For example, the U.S. dollar index is doing the same thing as it did eight years ago – it’s moving lower. As for the interpretation of the trend of the US dollar, we have actually already discussed it last month. During Trump’s first term eight years ago, the rise of the US dollar was particularly hot before Trump took office, but it began to die down after he actually took office.
At present, many people have begun to worry that the uncertainty caused by the stop-and-go trade war may begin to undermine people's confidence in the US economy and weaken the market's initial optimistic reaction to Trump's election in November. As Jerry Minier, co-head of G10 foreign exchange trading at Barclays Bank, said, "You still need to find reasons for the dollar to continue to rise - but at least those reasons have been removed for now."
And perhaps the more interesting phenomenon is that European stocks and A shares have risen, just like eight years ago.
The rise of the DAX index in 2017 is the result of the combined effect of "global recovery + policy dividends + structural advantages". Although Trump's trade protectionism put pressure on German industry in later periods (such as 2018), the fiscal stimulus expectations in his early days in office resonated with the global economy and were still the key to driving the DAX higher in its first year. In addition, structural factors such as the high dependence of German companies on exports and the weakness of the euro also amplified market optimism at this stage.
The CSI 300 Index can be said to be the asset that is currently performing most closely to the Trump 1.0 era.
The rise of the CSI 300 in 2017 was due to the combined effects of “low valuation repair + domestic demand policy dividends + profit growth + increased foreign investment”. Although Trump's trade policy has laid hidden dangers, its impact has not yet become apparent in the first year, and domestic economic resilience and structural reforms dominate market logic. In addition, in June 2017, MSCI announced that it would include Chinese A shares in its emerging market index, and foreign capital continued to increase its holdings of core assets through the Shanghai-Hong Kong Stock Connect. In 2017, net foreign capital inflows exceeded 200 billion yuan, strengthening the premium effect of leading stocks.
It can be said that although the logic behind the current rise of European stocks and A-shares is not exactly the same as it was eight years ago, there is an advantage that was not even available eight years ago, that is, the correction of U.S. stocks is triggering a reconfiguration of global capital flows - and whether it is the fiscal measures of EU countries to increase spending, or the technological wave triggered by China's Deepseek, both are creating historic structural opportunities for the two markets.


 Alex
Alex

