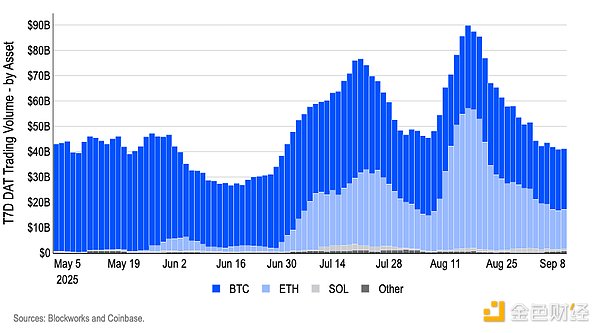
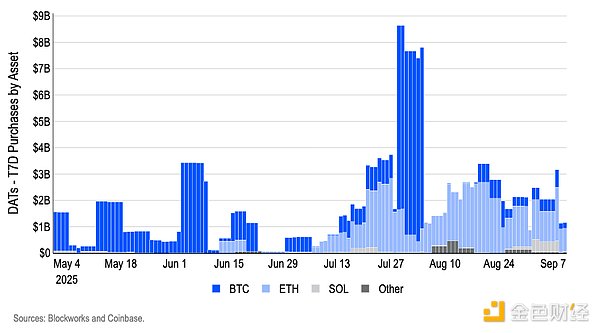
The inflation trend remains intact – August's headline CPI slightly exceeded expectations (+0.4% mom vs. +0.3% median forecast), driven by continued gains in core services/housing and energy. This reading was not enough to reverse the trend in annualized inflation, and more importantly, the core CPI remains contained (super core services rose only 0.33% vs. 0.48% in July). However, we believe these readings are sufficient to deter conservative Board members from taking more aggressive cuts this month. Employment is Crucial – Despite this, expectations of a payroll cut persist, as the Bureau of Labor Statistics this week lowered its initial estimate of nonfarm payrolls by 911,000, suggesting that labor market slack may have begun as early as the spring of 2024. If so, this would mean the business cycle actually peaked in early Q2 2024, and recent data suggests we may have extended this downturn. Housing – We view housing as the biggest risk factor for the US economy right now, as housing starts and permits have fallen to their lowest levels in years, despite a 2.9% year-over-year increase in the median US home price. Combined with weak labor market data, the outlook for the real economy is bleak from the perspective of a prolonged period of high interest rates. Credibility – Despite this, a 50 basis point rate cut would be interpreted as suggesting policy is too tight for an extended period, contradicting months of "data-dependent" guidance. A gradual approach allows the Committee to update on labor and inflation data without locking in an aggressive path. From the perspective of the policy loss function, the risks for the Fed are asymmetric: the cost of over-easing and reigniting price pressures is greater than the cost of over-easing and having to revisit at the next meeting. Figure 1: Futures prices currently reflect 100% certainty of a September rate cut, with a very low probability of a 50 basis point cut. A Deep Dive into DATs The mNAV of most digital treasuries (DATs) has largely converged to parity, with ETH DAT experiencing the most significant compression since May. We believe this indicates that the "DAT premium" is disappearing and that we have entered a valuation-constrained PvP phase. The weighted average mNAV of ETH DATs has fallen from a high of over 5x in early summer to below 1x in early September (Figure 2). We believe this pattern indicates that: 1) investors now price ETH DAT shares primarily as a pass-through for underlying reserve assets, rather than as a speculative "play" in the cryptocurrency frenzy; and 2) competition among issuers has offset much of the "DAT premium." Figure 2. Weighted Average mNAV of Digital Asset Treasury by Asset Class. DAT trading volume peaked in mid-August and retreated in September, suggesting a gradual fading of the DAT narrative and a re-anchoring of valuations to net asset value (NAV). During this period, DAT's trailing seven-day trading volume declined by approximately 55%, with ETH DAT's share shrinking alongside BTC DAT's (Figure 3). Using trading volume as an indicator of interest, we believe the DAT narrative is weakening marginally, potentially reducing market participants' willingness to pay a speculative premium. The surge in Treasury purchases in late July/August, with trading volumes surging and cryptocurrency prices subsequently consolidating, highlights the liquidity-driven nature of the trade: when primary buying momentum slows and macro uncertainty dampens market sentiment, enthusiasm wanes and mNAV retreats to around 1 (Figure 4).
Figure 3. T7D DAT Trading Volume – By Asset

Figure 4. T7D DAT Purchase Volume – By Asset

However, despite the decline in trading volume and premium compression, balance sheet absorption continues – most notably ETH—resulting in a shift in focus from mispricing to capital flows and structural factors. Net asset value (NAV) of DATs and the share of total supply held by DATs continued to rise in September (Exhibits 5 and 6), suggesting that even with DAT equity pricing close to NAV, they remain structural demand absorbers of circulating supply. We believe the combination of rising ownership share and mNAV ≈ 1 defines a PvP phase. Cross-sectional results depend on implementation and policy choices (funding mix, pace of capital purchases, treatment of staked ETH), while at the aggregate level, the constraining variable is simply the pace and breadth of net capital purchases, not any persistent equity premium. However, we note that the PvP phase could reverse if the cryptocurrency market regains momentum, as we believe that under risk-on regimes, when attention outpaces major offerings, speculative premiums could re-emerge, forming a transient wedge. We believe that the key determinant of whether such a regime returns is likely to be macro liquidity – in particular the trajectory of policy rates – which we believe plays a greater role in shaping risk appetite than the fundamentals of specific protocols. Figure 5. T7D DAT Net Asset Value – By Asset
 Weiliang
 Weiliang
 Alex
Alex Alex
Alex Miyuki
 Weiliang
 Brian
Brian Alex
Alex Alex
Alex Miyuki
 Weiliang