Author: Tanay Ved, Victor Ramirez Source: Coin Metrics Translation: Shan Ouba, Golden Finance
Main Points:
Bitcoin’s correlation with stocks and gold has recently fallen to near zero, indicating a classic “decoupling” phase, which usually occurs during major market events or shocks.
Bitcoin’s correlation with interest rates is generally low, but changes in monetary policy have a certain impact on its performance, especially during the 2022–2023 rate hike cycle, when Bitcoin showed the strongest negative correlation with interest rates.
Despite being called "digital gold", Bitcoin has historically shown a higher "Beta value", that is, a stronger sensitivity to stock market gains, especially in phases of macroeconomic bullishness.
Since 2021, Bitcoin's realized volatility has continued to decline, and is now close to the volatility of some mainstream technology stocks, showing that its risk attributes are maturing.
Introduction
Is Bitcoin decoupling from traditional markets? Its recent strong performance relative to gold and stocks has once again sparked this discussion. Over the past 16 years, Bitcoin has been labeled with various labels, from "digital gold" to "value store" to "risk asset".
But does Bitcoin really meet these definitions? Is it a unique investment, or just a leveraged expression of existing risky assets?
This article will take a deep dive into Bitcoin’s behavior in different market environments, focusing on periods of reduced correlation with traditional assets such as stocks and gold and the drivers behind this. We will also explore the impact of monetary policy changes on Bitcoin’s performance, Bitcoin’s sensitivity to macro markets, and how it compares to other major assets in terms of volatility.
Bitcoin’s performance in different interest rate environments
The Federal Reserve is one of the most influential forces in global financial markets due to its ability to directly influence interest rates. Changes in the federal funds rate directly affect money supply, market liquidity, and investors’ risk appetite, both in tightening and easing phases.
Over the past decade, we have experienced a transition from a zero interest rate era, unprecedented easing during COVID, to an aggressive rate hike cycle in 2022 to combat inflation.
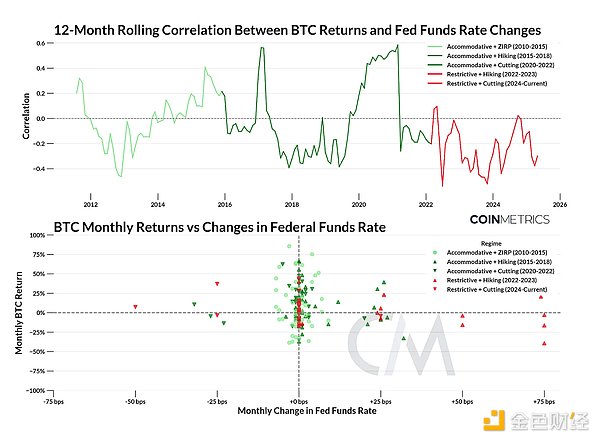
To understand Bitcoin's sensitivity to monetary policy changes, we divide its history into 5 key interest rate cycles. These cycles are categorized based on the direction and level of interest rates, ranging from easing phase (Fed Funds Rate <2%) to tightening phase (Fed Funds Rate >2%).
Given the infrequency of interest rate changes themselves, we compare Bitcoin's monthly returns with the monthly changes in the Fed Funds Rate.

Source: Coin Metrics Reference Rates and Federal Reserve Bank of New York
While Bitcoin’s correlation with interest rate changes is generally low and concentrated near the center, distinct patterns emerge particularly during policy regime shifts:
Easy Policy + Zero Interest Rate Policy (2010-2015): Driven by zero interest rates following the 2008 financial crisis, Bitcoin’s returns during this period reached an all-time high. The correlation with interest rates is roughly neutral, consistent with Bitcoin's early growth phase.
Easy + Rate Hikes (2015-2018):As the Fed began to raise interest rates to 2%, Bitcoin's returns fluctuated wildly. Although the correlation rose in 2017, it remained generally low, indicating a disconnect with macro policy.
Easy + Rate Cuts (2018-2022):In response to the COVID-19 pandemic, the Fed began to slash interest rates and implement fiscal stimulus, followed by two years of near-zero interest rates. Bitcoin's returns were volatile but skewed toward positive values. During this period, the correlation fluctuated wildly, rising from below -0.3 in 2019 to +0.59 in 2021 before falling back to near neutral.
Restrictive Rate Hikes (2022-2023):In response to surging inflation, the Federal Reserve embarked on one of the fastest rate hike cycles in history, pushing the federal funds rate above 5%. This cycle shows the strongest negative correlation between BTC and interest rate changes. Bitcoin’s performance has weakened against the backdrop of tighter financial conditions and rising risk aversion, compounded by crypto-specific shocks such as the FTX crash in November 2022.
Restrictive + Rate Cuts (2023-Present):With three high-volume rate cuts completed, we’ve seen Bitcoin (BTC) perform neutral to slightly positive. During this period, catalysts such as the U.S. presidential election and shocks such as the trade war have continued to influence its performance. The correlation remains negative, but appears to be inching closer to zero, suggesting that Bitcoin is in a transition phase as the macro environment begins to ease.
While interest rates set the backdrop, comparing Bitcoin to stocks and gold helps shed light on its relative behavior to major asset classes.
How Bitcoin Returns Follow Gold and Stocks
Correlation
The most straightforward way to tell if one asset is decoupling from another is to look at the correlation of returns. Below is a chart of the 90-day correlation between Bitcoin and the S&P 500 and gold. Indeed, we do see historically low correlations between Bitcoin and both gold and stocks. Typically, Bitcoin returns fluctuate between correlations with either gold or stocks, with the correlation with gold generally being higher. Notably, Bitcoin’s correlation with the S&P 500 rose in 2025 as sentiment across the board improved. But starting around February 2025, Bitcoin’s correlations with both gold and stocks have trended toward zero, suggesting that Bitcoin is in a unique phase of “decoupling” from both gold and stocks. This has not happened since the peak of the previous cycle in late 2021.
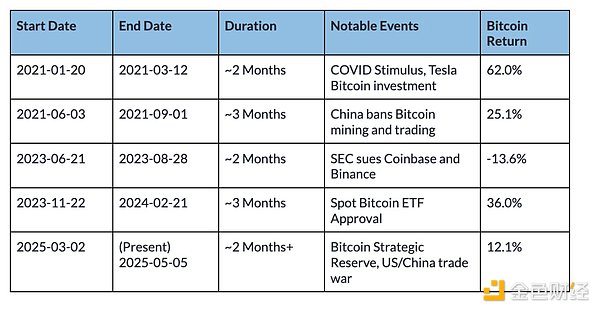
What usually happens when correlations are so low? We collated the periods when the 90-day rolling correlation between Bitcoin and the S&P 500 and gold was below the significance threshold (around 0.15) and annotated the most noteworthy events at that time.
Periods of Low Correlation Between Bitcoin and the S&P 500

Periods of Low Correlation Between Bitcoin and Gold
As expected, past decoupling occurred during periods of major idiosyncratic shocks to the cryptocurrency market, such as China’s ban on Bitcoin and the approval of a spot Bitcoin ETF. Historically, periods of low correlation usually last around 2-3 months, but this depends on the threshold of the correlation.
These periods were indeed accompanied by modest positive returns, but given that each period was unique in its own way, it would be wise to reflect on what made these periods unique before drawing any conclusions about Bitcoin’s recent performance. That being said, Bitcoin’s recent low correlation with other assets is a desirable property for those looking to allocate a large portion of Bitcoin in a risk-diversified portfolio.
Market Beta
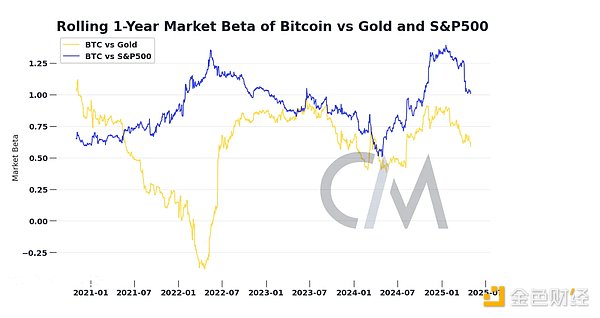
In addition to correlation, market beta is another useful measure of the relationship between an asset and market returns. Market beta quantifies how much an asset’s return is expected to move with market assets and is calculated by subtracting the sensitivity of an asset’s return from the risk-free rate relative to a benchmark. While correlation measures the direction and strength of the linear relationship between an asset’s and a benchmark’s returns, market beta measures the direction and magnitude of an asset’s sensitivity to market movements, adjusted for market volatility.
For example, Bitcoin is often said to have a “high beta” relative to the stock market. Specifically, if an asset (such as Bitcoin) has a market beta of 1.5, then when the market benchmark asset (S&P 500 index) changes by 1%, its returns are expected to increase by 1.5%. A negative beta coefficient means that the return of the asset is negative relative to a positive change in the benchmark asset.

For most of 2024, Bitcoin's beta coefficient relative to the S&P 500 was well above 1, meaning it was highly sensitive to stock market fluctuations. In a bullish, risk-on market environment, investors who hold a certain amount of Bitcoin can earn much more than those who only hold the S&P 500. Although Bitcoin is often called "digital gold", its low beta coefficient relative to analog gold means that holding both assets can hedge the downside risk of each asset.
As we move further into 2025, Bitcoin has begun to trade at a lower beta coefficient than the S&P 500 and gold. Bitcoin remains sensitive to market risk and its returns are still linked to market returns, although the degree of dependence on market returns has decreased. Bitcoin may be becoming a unique asset class, but it still trades like a risk asset, and there is no strong evidence that it has become a "safe haven" asset.
Bitcoin's performance during periods of high volatility
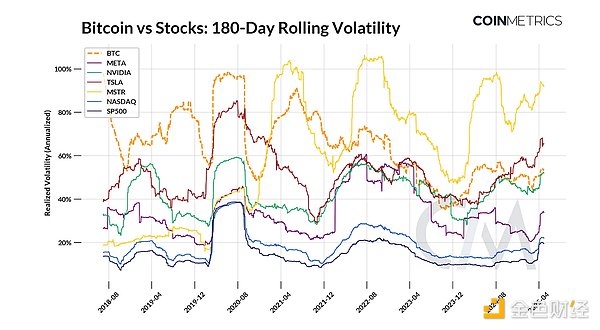
Realized volatility is another dimension to understanding Bitcoin's risk profile, which measures how much Bitcoin's price fluctuates over a period of time. Volatility is often considered one of Bitcoin's core characteristics, both as a driver of risk and a source of return. The chart below compares the 180-day rolling realized volatility of Bitcoin with major indices such as the Nasdaq, S&P 500, and some technology stocks.

Source: Coin Metrics Reference Rate and Google Finance, based on Coin Metrics's realized volatility methodology
Bitcoin's volatility has been trending downward over time. In its early stages, driven by explosive rallies and pullback cycles, its realized volatility often exceeded 80% to 100%. Volatility rose in tandem with the stock market during the COVID-19 pandemic, and also rose independently during 2021 and 2022, driven by crypto-specific shocks such as the Terra Luna and FTX crashes.
However, its 180-day realized volatility has gradually declined since 2021, and has recently stabilized at around 50-60% even amid increased market volatility. This puts it on par with many popular tech stocks, below MSTR and TSLA, and close to NVIDIA in terms of holding size. While still susceptible to short-term market fluctuations, its relative stability compared to past cycles may reflect its maturity as an asset and the evolving ownership base.
Conclusion
Has Bitcoin decoupled from the rest of the market? It depends on how you measure it. Bitcoin is not completely isolated from the real world. It remains subject to the market forces that affect all assets: interest rates, idiosyncratic market events, and of course the returns of other financial assets. Recently, we’ve seen Bitcoin’s returns become uncorrelated with the rest of the market, but whether this is a temporary trend or part of a longer-term market mechanism remains to be seen. As with all trends: it’s there until it’s not.
Whether Bitcoin has decoupled raises a larger question: what role does it play in a portfolio seeking to diversify against other market risks? Bitcoin’s risk and return profile can send investors into a narrative tizzy: one week it’s the highly leveraged Nasdaq, the next it’s digital gold, and the week after that it’s a hedge against fiat currency debasement. But this volatility may be a feature, not a bug. Rather than drawing imperfect analogies to other assets, it’s more constructive to understand why Bitcoin is moving in its own direction as it continues to mature into a unique asset class.
 JinseFinance
 JinseFinance
 Xu Lin
 Edmund
 JinseFinance
 Pr0phetMoggy
 Pr0phetMoggy
 Olive
Olive Beincrypto
 Bitcoinist
 Cointelegraph