Bitcoin has recently undergone its fourth halving, which has reduced its supply inflation by another 50% and naturally increased its deflation. In this article, we will explore the evolution of the Bitcoin network over time in terms of price performance and basic network metrics.
Abstract
Bitcoin has recently undergone its fourth halving since its inception, and the annualized inflation rate of Bitcoin supply has been reduced by another 50%, which also means that it has completely surpassed gold in terms of the scarcity of issuance.
When measuring the status of the Bitcoin network during the halving period, we found that the growth rate of several important indicators has slowed down. However, its growth trend will not stop, and each time it creates a new historical peak.
The rise in spot prices and the significant breakthrough of historical price peaks have boosted investor profitability, which in turn has reversed the unfavorable situation that miners' revenue has fallen by 50% since the beginning of the year.
Deflationary Supply
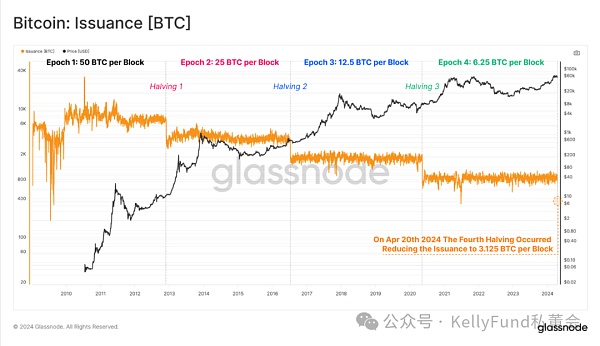
The Bitcoin supply curve is deterministic due to a clever algorithm called "adaptive difficulty adjustment". This algorithm constantly adjusts the difficulty of the Bitcoin mining process, which allows the average block interval of the Bitcoin network to remain around 600 seconds (10 minutes) regardless of the computing power of the equipment used by the miner.
Every 210,000 blocks (about 4 years), the Bitcoin network will experience a scheduled issuance halving, resulting in a 50% reduction in the amount of newly minted Bitcoins. The fourth Bitcoin halving took place last weekend, with the block subsidy dropping from 6.25 Bitcoins per block to 3.125 Bitcoins, meaning that the network can mint about 450 Bitcoins per day (for the 144 blocks mined).
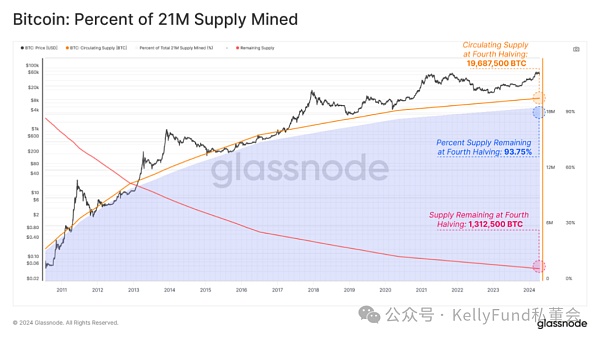
In the first four epochs after Bitcoin was created, a total of 19,687,500 Bitcoins were mined, equivalent to 93.75% of the pre-set total supply of 21 million Bitcoins. Therefore, there are only 1,312,500 Bitcoins left to be mined in the next 126 years, of which 656,600 Bitcoins (3.125% of the total) have been issued in the current epoch (between the third and fourth halvings). Interestingly, each halving represents a key point:
The percentage of supply remaining to be mined equals the new block subsidy (3.125 BTC/block vs 3.125% remaining).
50% of the supply remaining to be mined (1,312,500 BTC) will be mined between the fourth and fifth halvings.
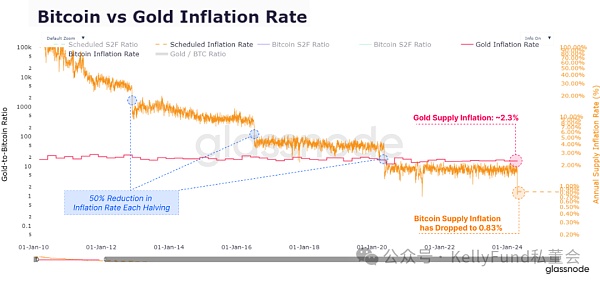
Since the block subsidy halves every 210,000 blocks, Bitcoin’s inflation rate also halves approximately every 4 years. This brings the latest annualized inflation rate of Bitcoin’s supply to 0.85%, down from 1.7% in the previous period.
The fourth halving also marks an important milestone when people compare Bitcoin to gold, the two general equivalents. For the first time in history, Bitcoin's steady-state issuance rate (0.83%) is lower than gold (~2.3%), marking the historic handover of the title of "the scarcest asset" from gold to Bitcoin.
Be Cautious
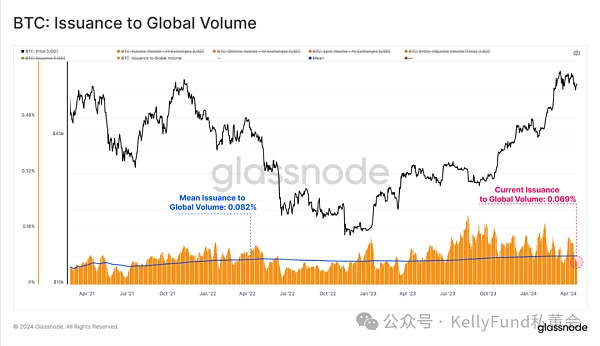
However, it is important to point out that we need to put the scale of this halving in perspective. When assessing the relative impact of the halving on market dynamics, we must see that the total amount of newly minted Bitcoins after the halving is still very small compared to the global transaction volume within the Bitcoin ecosystem. At this point in time, the total amount of Bitcoin minted after the halving is only a fraction of the on-chain transfer volume, spot trading volume, and derivatives volume we see today, currently equivalent to less than 0.1% of the total capital transferred and traded on any given day.
Thus, the impact of Bitcoin halvings on the available trading supply is weakening across cycles, not only because the number of Bitcoin mined after the halving continues to decrease, but also because the size of the assets and ecosystem surrounding it continues to expand.
Reasonable Expectations
Bitcoin’s halving is a significant and well-publicized event, and each approaching halving naturally leads to increased speculation about its impact on price action. Balancing the difference in our expectations with historical precedent and creating a relatively loose analysis boundary based on Bitcoin’s past performance may be a more sensible market analysis strategy.
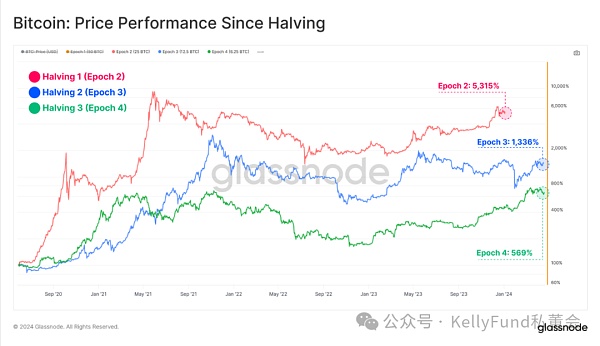
Bitcoin's price performance in each halving period varies greatly. We believe that the early halving period is very different from today, and past experience may not be able to provide much guidance for our current analysis and prediction. But over time, we do see diminishing returns and weakening total drawdown effects, which is a natural result of the expanding market size and the expansion of the scale of working capital required to drive market growth.
Red: Epoch 2 price performance: +5,315%, maximum retracement of -85%
Blue: Epoch 3 price performance: +1,336%, maximum retracement of -83%
Green: Epoch 4 price performance: +569%, maximum retracement of -77%
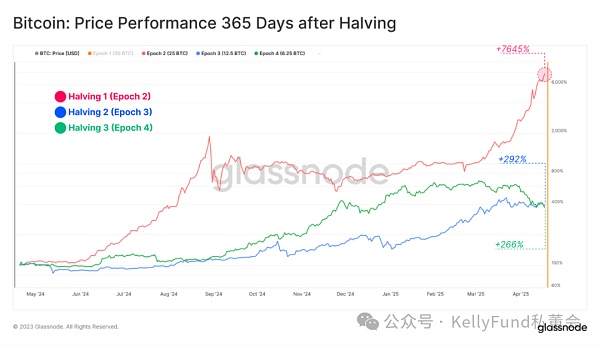
That is why we find that the impact of the halving events in the two most recent eras (the third era and the fourth era) on asset size is richer and more interpretable.
Red: Epoch 2 price performance: +7,258%, maximum retracement of -69.4%
Blue: Epoch 3 price performance: +293%, maximum retracement of -29.6%
Green: Epoch 4 price performance: +266%, maximum retracement of -45.6%
Although in general, the overall market trend is strong in the year after each halving event, there are still some very large retracements in the process, with the maximum ranging from 30% to 70%.
History's intermittent rhythm
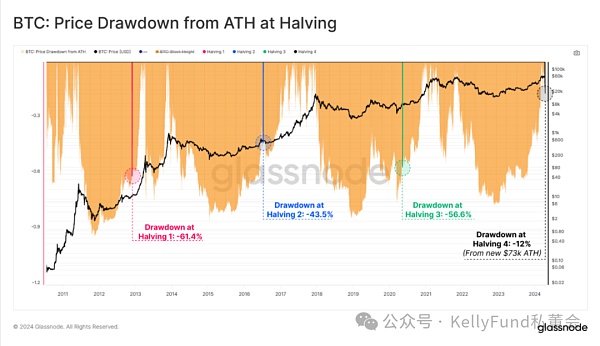
During the 2022 bear market, a widely circulated saying that no matter how much the price of Bitcoin fell, it would never fall below the historical peak of the previous cycle (the corresponding historical peak was $20,000 in 2017). Unfortunately, this law is invalid, because during the widespread deleveraging process at the end of 2022, the price of Bitcoin fell by more than 25% from the cycle high in 2017.
Similarly, a similar saying has been circulating recently that the price of Bitcoin cannot break through the historical peak of the current cycle before the halving occurs. But in March this year, this "law" was also broken. The new historical peak we saw at that time was refreshed again. This event was due to the unprecedented supply tightness in history (we mentioned this reason in previous articles) and the significant increase in demand interest brought by the newly listed spot ETF.
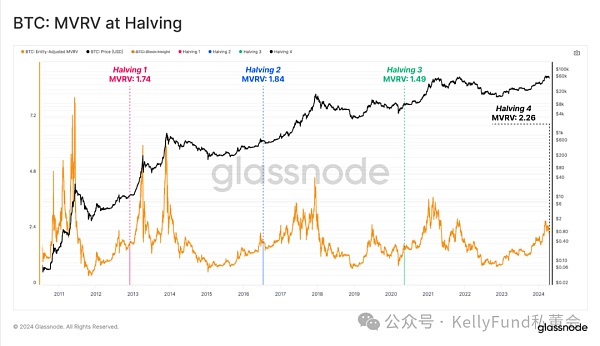
But we must see that this price increase of Bitcoin also has a significant impact on the unrealized profits held by investors. In the current Bitcoin supply, the unrealized profits held by investors are the largest since the halving event (measured by MVRV).
In other words, as of the date of the halving, investors hold the largest paper gains relative to their costs. At present, the MVRV ratio is 2.26, which means that the average unit book gain of Bitcoin is +126%.
Fundamental Growth
In the previous section, we evaluated the performance of Bitcoin price in various historical cycles with halving as the node. In this section, we will turn our focus to the growth of Bitcoin network fundamentals, which include mining security, miner income, asset liquidity, and transaction settlement volume during the halving period.
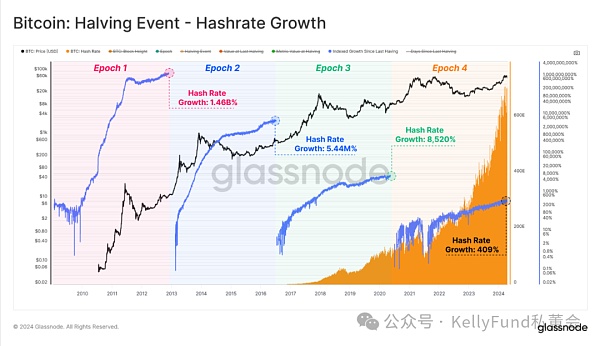
Hash rate is a network statistic used to evaluate the collective "firepower" of mining. During the halving period, the growth rate of hash rate has slowed down, but the absolute hash rate per second continues to grow and is currently 620 Exahash per second (this is equivalent to all 8 billion people on the earth completing 77.5 billion hash operations per second).
Interestingly, hashrate is at or near new historical peaks at each halving event, suggesting that at least one of two scenarios may be occurring:
More ASIC devices are coming online;
More efficient hashing ASIC hardware is in production.
The conclusion drawn from both scenarios is that, despite the 50% reduction in issuance with each halving, the overall security budget is not only sufficient to maintain current OPEX (operating expense) costs, but also sufficient to stimulate further investment in the CAPEX (capital expenditure) and OPEX areas.
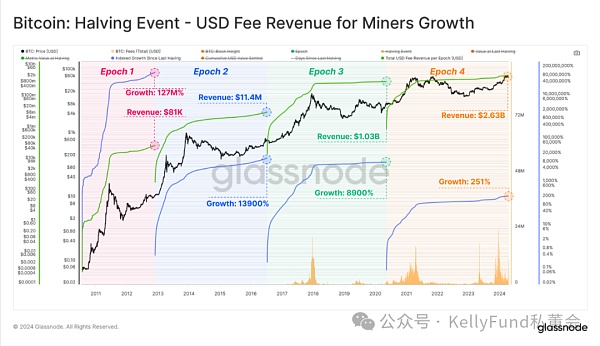
Now we calculate the income of miners in US dollars, and we find that although the current growth rate of income is also declining, the absolute scale is still in net expansion. In the past 4 years, the cumulative income of miners has reached an astonishing 3 billion US dollars, an order of magnitude increase over the previous era.
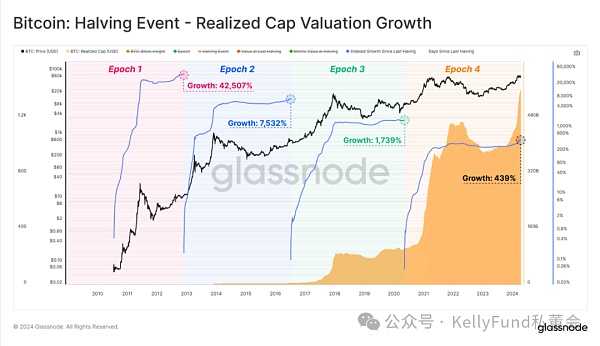
Here we reiterate the important market indicator we currently use - the realized cap. It is a powerful tool to measure the capital invested and stored in Bitcoin over a period of time, and can be used to compare the cross-cycle liquidity growth of Bitcoin denominated in US dollars.
When we measure the entire Bitcoin market by this metric, we see that a total value of $560 billion has been “stored” in Bitcoin. This is a staggering 439% increase in realized cap over the previous period, supporting the asset’s current market cap of $1.4 trillion. It is also worth noting that despite Bitcoin’s notoriously high volatility, bad headlines, and periodic horror drawdowns, capital continues to flow into the market.
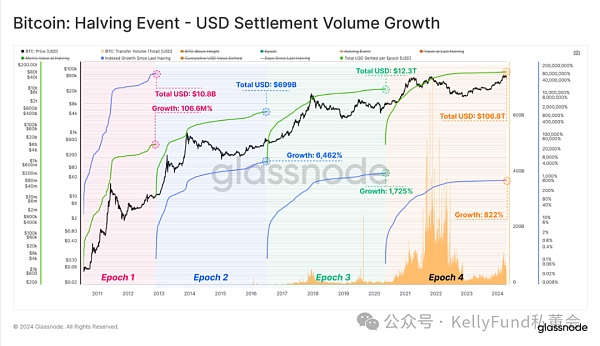
Finally, if we assess the total volume of transactions settled across the network during the halving period, we see that the total economic volume transferred and settled on the network over the past four years has been as high as $106 trillion. It is important to note that this number considers raw, unfiltered transaction volume and does not take into account data corrections caused by internal management of assets in wallets.
In addition, we also see that each transaction is settled without an intermediary, which highlights the incredible large-scale value throughput capacity of the Bitcoin network.
Summary
With the completion of Bitcoin's much-anticipated halving, the issuance of each block has been halved, and the scarcity of the asset has increased accordingly. Under this condition, the issuance scarcity of Bitcoin assets still decisively surpasses gold.
Compared with previous periods, we see that the growth of computing power, network settlement, liquidity, and miner income has all contracted. However, the absolute values of these indicators have increased by an order of magnitude. From the perspective of market size, Bitcoin has accomplished an incredible and impressive feat.
It is worth noting that compared with the previous halvings, the network profitability of market investors from all walks of life has increased significantly in this halving. These investors also include the basic mining group. In this halving, the total computing power they provide has reached a new historical peak, which shows that the current market still has enough security budget to stimulate the demand for operating expenses and capital expenditures.


 Catherine

