Without AA, there is no future of chain abstraction: What stage has AA reached?
As I delved deeper into chain abstraction, one thing became extremely clear: without account abstraction (AA), there is no future for chain abstraction.
 JinseFinance

Author: 0xWeilan
Affected by the US economic and employment data, the expectation of restarting interest rate cuts is uncertain, the inflow and outflow of main pricing funds are uncertain, coupled with cross-cycle long-term selling and on-site fund rotation,
the overall crypto market in August showed a "weak-to-strong-then-weak" trend, and the price showed an "arch" shape. BTC fell 6.49% for the month, closing at $108,247.95. Ethereum, a representative altcoin, surged 18.75%, closing at $4,391.83. According to eMerge Engine, BTC is currently in the late stages of a bull market. In our June report, we predicted that BTC would initiate its fourth upward trend in the third quarter and reach a new all-time high. This assessment was confirmed in July. Entering August, the impact of the "reciprocal tariff war" began to show up in US economic data, with both CPI and PCE rebounding. This continued to dampen market expectations for a resumption of interest rate cuts in September, causing volatility in the US stock market, which had overpriced in a resumption of rate cuts. This volatility was transmitted to the crypto market via the Crypto Spot ETF, ultimately pricing BTC downward after reaching a record high in mid-month. This is a typical sign of risk appetite rebalancing. During this period of volatility, capital outflows were not continuous, but rather appeared to be indecisive. Overall, BTC still received $329 million in inflows this month. The fundamental cause of the price decline is cross-cycle long-term selling and sector rotation within the crypto market. The massive sell-off by ancient whales locked in profits and drained scarce liquidity. Simultaneously, billions of dollars flowed from BTC into ETH both on and off the exchange. EMC Labs believes this collectively contributed to BTC's decline from its all-time high to the "Trump bottom" of $90,000-110,000. The market has essentially repriced in its interest rate cut expectations, with the implied price being a September rate cut, the second rate cut this year, totaling 50 basis points. With several economic, employment, and inflation data still to be released before September 17, the market is expected to remain volatile. However, with the resumption of interest rate cuts, a soft landing for the US economy driven by AI capital expenditures and technology-driven growth, and a decline in employment data but not to a worsening degree, this remains a high probability event. EMC Labs is cautiously optimistic about the September market. We believe that after experiencing necessary short-term fluctuations, BTC will continue its fourth wave of growth. Macro-Finance: "Inflation Rebound" and "Cold Employment" Drive Expectations of Rate CutsIn August, the US capital market was primarily driven by the oscillation between three key variables: economic and inflation data performance, expectations of when the Fed will resume rate cuts, and concerns about Fed independence. The overall market trend was initially cold, then hot, and then cold again.
On August 1st, employment data was released. The US unemployment rate rose month-over-month in July, and non-farm payrolls increased by 73,000 jobs, far below the previously expected 100,000. At the same time, the U.S. Bureau of Labor Statistics significantly revised downward its data for May and June, with the June figure revised by over 90%. Following the release of this surprising data, the Nasdaq plummeted 2.24% that day, with Bitcoin (BTC) following suit, falling 2.17%. Influenced by the data, FedWatch showed that the probability of a 25 basis point rate cut by the Federal Reserve in September rose sharply to 75.5%, up from 37.7% the previous day. The US dollar index plummeted by 1.23% that day and continued its downward trend. This data rekindled market expectations of a September rate cut, leading to a continued upward trend in US stocks and Bitcoin. BTC reached a record high of $124,533.00 on August 14. On August 12, the US CPI data released was in line with market expectations and had no significant impact on the market. However, the market, which had fully priced in the rate cut, remained highly sensitive to inflation data. On August 14th, the PPI data was released, showing an annualized growth of 3.3%, significantly exceeding market expectations of 2.5%. Concerns that rising production costs would eventually be transmitted to consumers initially dampened market expectations for interest rate cuts. After hitting a record high, BTC began to decline, continuing its decline until the end of the month. During the same period, the tech-dominated Nasdaq began to weaken, with funds shifting from highly valued tech stocks to cyclical and consumer stocks, and the Dow Jones began to strengthen. This suggests that expectations for rate cuts have not been shattered, but rather downward adjustments have been made, prompting investors to seek out assets with safer valuations. On August 20th, at the Jackson Hole Global Central Bank Conference, Federal Reserve Chairman Powell delivered his most dovish tone yet this year, suggesting a greater focus on the cooling job market and the possibility of rate cuts to boost its recovery. Markets were reassured, with traders pricing in a probability of a September rate cut exceeding 70% until the end of the month. The core PCE data released on August 29th, while largely in line with expectations, showed an annualized increase of 2.9%, the highest since February 2025, indicating a slight increase in underlying inflationary pressures. All three major US stock indices fell in response, but the Dow Jones Industrial Average's decline was significantly smaller than that of the Nasdaq.
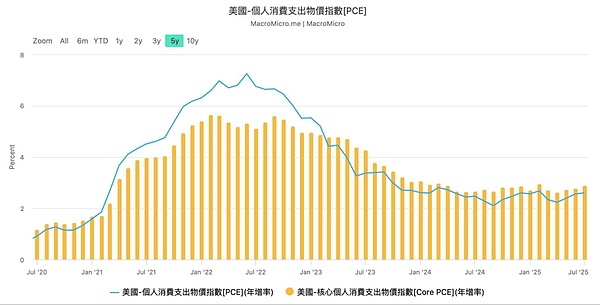
U.S. PCE index annual rate
As of the end of the month, the market had fully priced in
“resume interest rate cuts in September, twice this year, for a total of 50 basis points”. US President Trump escalated pressure on the Federal Reserve to cut interest rates, announcing on social media at the end of the month that he had fired Federal Reserve Governor Lisa Cook, who had advocated against a rate cut, for allegedly falsifying mortgage documents. This incident further heightened market concerns about the Fed's independence. Crypto Assets: BTC Returns to the "Trump Bottom," ETH Sees Record Inflows In August, BTC exhibited an arching trend. Suppressed by sharply downward revisions to employment data at the beginning of the month, it quickly resumed its upward trend, fueled by an over 80% probability of an interest rate cut, reaching a new all-time high on August 14th. Following the release of the PPI data on the 14th, the market continued its downward trend in the second half of the month. Technically, BTC retreated to the "Trump Bottom" (between $90,000 and $110,000), temporarily breaking through the current bull market's first rising trend line and the important 120-day moving average. BTC Daily Price Chart: After a four-month rebound, BTC has retreated 6.49% on a monthly basis, with trading volume shrinking slightly. This month's BTC price decline can be seen as a technical correction driven by a combination of a correction in overpricing and a shift in capital flows. We believe that with the resumption of the interest rate cut cycle and shifts in market risk appetite, mainstream capital will flow back into BTC, driving its fourth wave of growth in this cycle. BTC's decline has largely tracked the Nasdaq and is related to expectations of interest rate cuts. It's generally believed that risky assets will continue to strengthen after the market enters a cycle of interest rate cuts. While BTC is also a highly volatile asset, within the crypto market, it's considered a more "blue chip" asset compared to altcoins. With the approach of interest rate cuts and growing consensus on public blockchain assets, on- and off-exchange funds are accelerating into ETH. Fund Flows: ETH Inflows Exceed BTC by Over 10 Billion This month, the crypto market saw a total inflow of $27.778 billion, including $164.14 billion in stablecoins, $3.420 billion in the ETH Spot ETF, $7.485 billion in corporate purchases of ETH, $226 million in the SOL ETF, and $1.505 billion in corporate purchases of BTC. However, the BTC Spot ETF saw an outflow of $1.176 billion. Crypto Market Capital Inflow Statistics (Monthly) BTC Spot ETF and corporate purchases, currently the primary purchasing power, saw inflows of only $329 million, significantly lower than last month. This is the fundamental reason for BTC's weak performance this month. Meanwhile, ETH Spot ETF and corporate purchases of ETH reached a combined $10.805 billion, a record high. EMC Labs believes that both on- and off-exchange funds are clearly showing a trend of inflows from BTC to ETH. ETH Capital Inflow Statistics (Monthly) There are three reasons for this. First, over the past few years, consensus on BTC has largely spread in major countries like the United States, leading to increased investment in ETH, the second-largest cryptocurrency. Second, as the United States enters a crypto-friendly era, the trend of transforming the traditional financial industry with blockchain technology has begun to emerge. As the native currency of the leading smart contract platform, ETH has begun to attract increasing attention and allocation from industrial capital. Finally, BTC has already reached a new all-time high during this cycle, while ETH has yet to surpass the peak of the previous bull market. This, coupled with historical experience that altseason will eventually occur in a low-interest rate environment, has led to a surge in speculative funds into ETH, driving its price up rapidly. Based on the resumption of the interest rate cut cycle, the ongoing repricing of risk, and the historical rate of altseason, we proposed in last month's report that altseason is underway. We now believe ETH is in the mid-stage of price rediscovery within this cycle, with significant upside potential. With the resumption of interest rate cuts and increased risk appetite, a wider range of altcoins may experience a rapid rise driven by speculative buying. Chip Structure: The Third Sell-off Continues. In addition to fund rotation, another key factor contributing to the divergence in BTC and ETH prices in August is that long positions across and within the cycle have already initiated the third wave of BTC's current sell-off (previous bull markets only saw two sell-offs). In August, long-term investors accelerated their divestment, reducing their holdings by over 150,000 coins, including accounts from the Satoshi era that generated significant profits. These divestments drained scarce inflows, pushing prices downward for rebalancing. Due to the sheer size of individual entities, the sell-offs by these whales make the significant selling figures somewhat incidental. Current long-term holdings remain higher than in February, and with liquidity strengthening, the sell-off is expected to continue.
Statistics of long-term, short-term, miner, and centralized exchange holdings
From the perspective of exchanges, BTC outflows this month were 38,620, slightly less than last month, consistent with the characteristics of a bull market upswing.
The eMerge Engine shows that the BTC Metric is 0.375, indicating that BTC is in an upward relay phase. We believe that with the massive influx of treasury companies, Spot ETFs, and industrial capital, the crypto market has entered a new phase of "mainstream" development. For BTC, volatility will gradually decline, and its correlation with US stocks, especially the Nasdaq, will strengthen. For smart contract platform assets like ETH and SOL, the influx of mainstream capital is just the beginning, and the spread of consensus will inevitably lead to repricing. As we enter September, when interest rate cuts are imminent, the market will not be smooth sailing. High valuations in the US stock market and the Federal Reserve's independence continue to plague the market. However, the cycle will continue.
As I delved deeper into chain abstraction, one thing became extremely clear: without account abstraction (AA), there is no future for chain abstraction.
JinseFinanceStarknet’s main technical features include the Cairo language that facilitates ZK proof generation, native-level AA, and smart contract models that are independent of business logic and state storage.
JinseFinanceAEZ QF's funding focuses on long-term support for the construction of early public goods and appchains in the Cosmos ecosystem, and works with developers to build a more robust and growing ecosystem.
JinseFinanceIn a surprising twist, renowned economist Nouriel Roubini, who was once a staunch critic of cryptocurrencies, has launched his own digital token
 Aaron
AaronThe rating downgrade reflects Fitch's apprehension about the country's fiscal outlook and highlights the frequent clashes over the debt limit witnessed in the past two decades.
 Coinlive Coinlive
 Artificial intelligence is making a lot of people angry this week.
 NFT Now
 Beincrypto
The Digital Dollar Project is launching a central bank digital currency (CBDC) Technical Sandbox Program in October. The U.S...
 Ledgerinsights
Bloomberg senior commodity strategist Mike McGlone and financial commentator Frances Coppola discuss the impact of last week's Terra crash in a new interview with Cointelegraph.
 Cointelegraph